Oh, Bitcoin, you fickle beast. Sitting pretty (ha) between $111,851 and $112,121 in the last hour, slogging through a yawn-worthy daily range of $110,456 to $113,537. Market cap? $2.23 trillion. Volume? A whopping $80.54 billion. It’s like watching two toddlers fight over a toy that turns out to be a ticking time bomb. Bulls and bears are just staring each other down, wondering who’ll blink first. Talk about a high-stakes nap. Zzz… or boom? 💸
Bitcoin
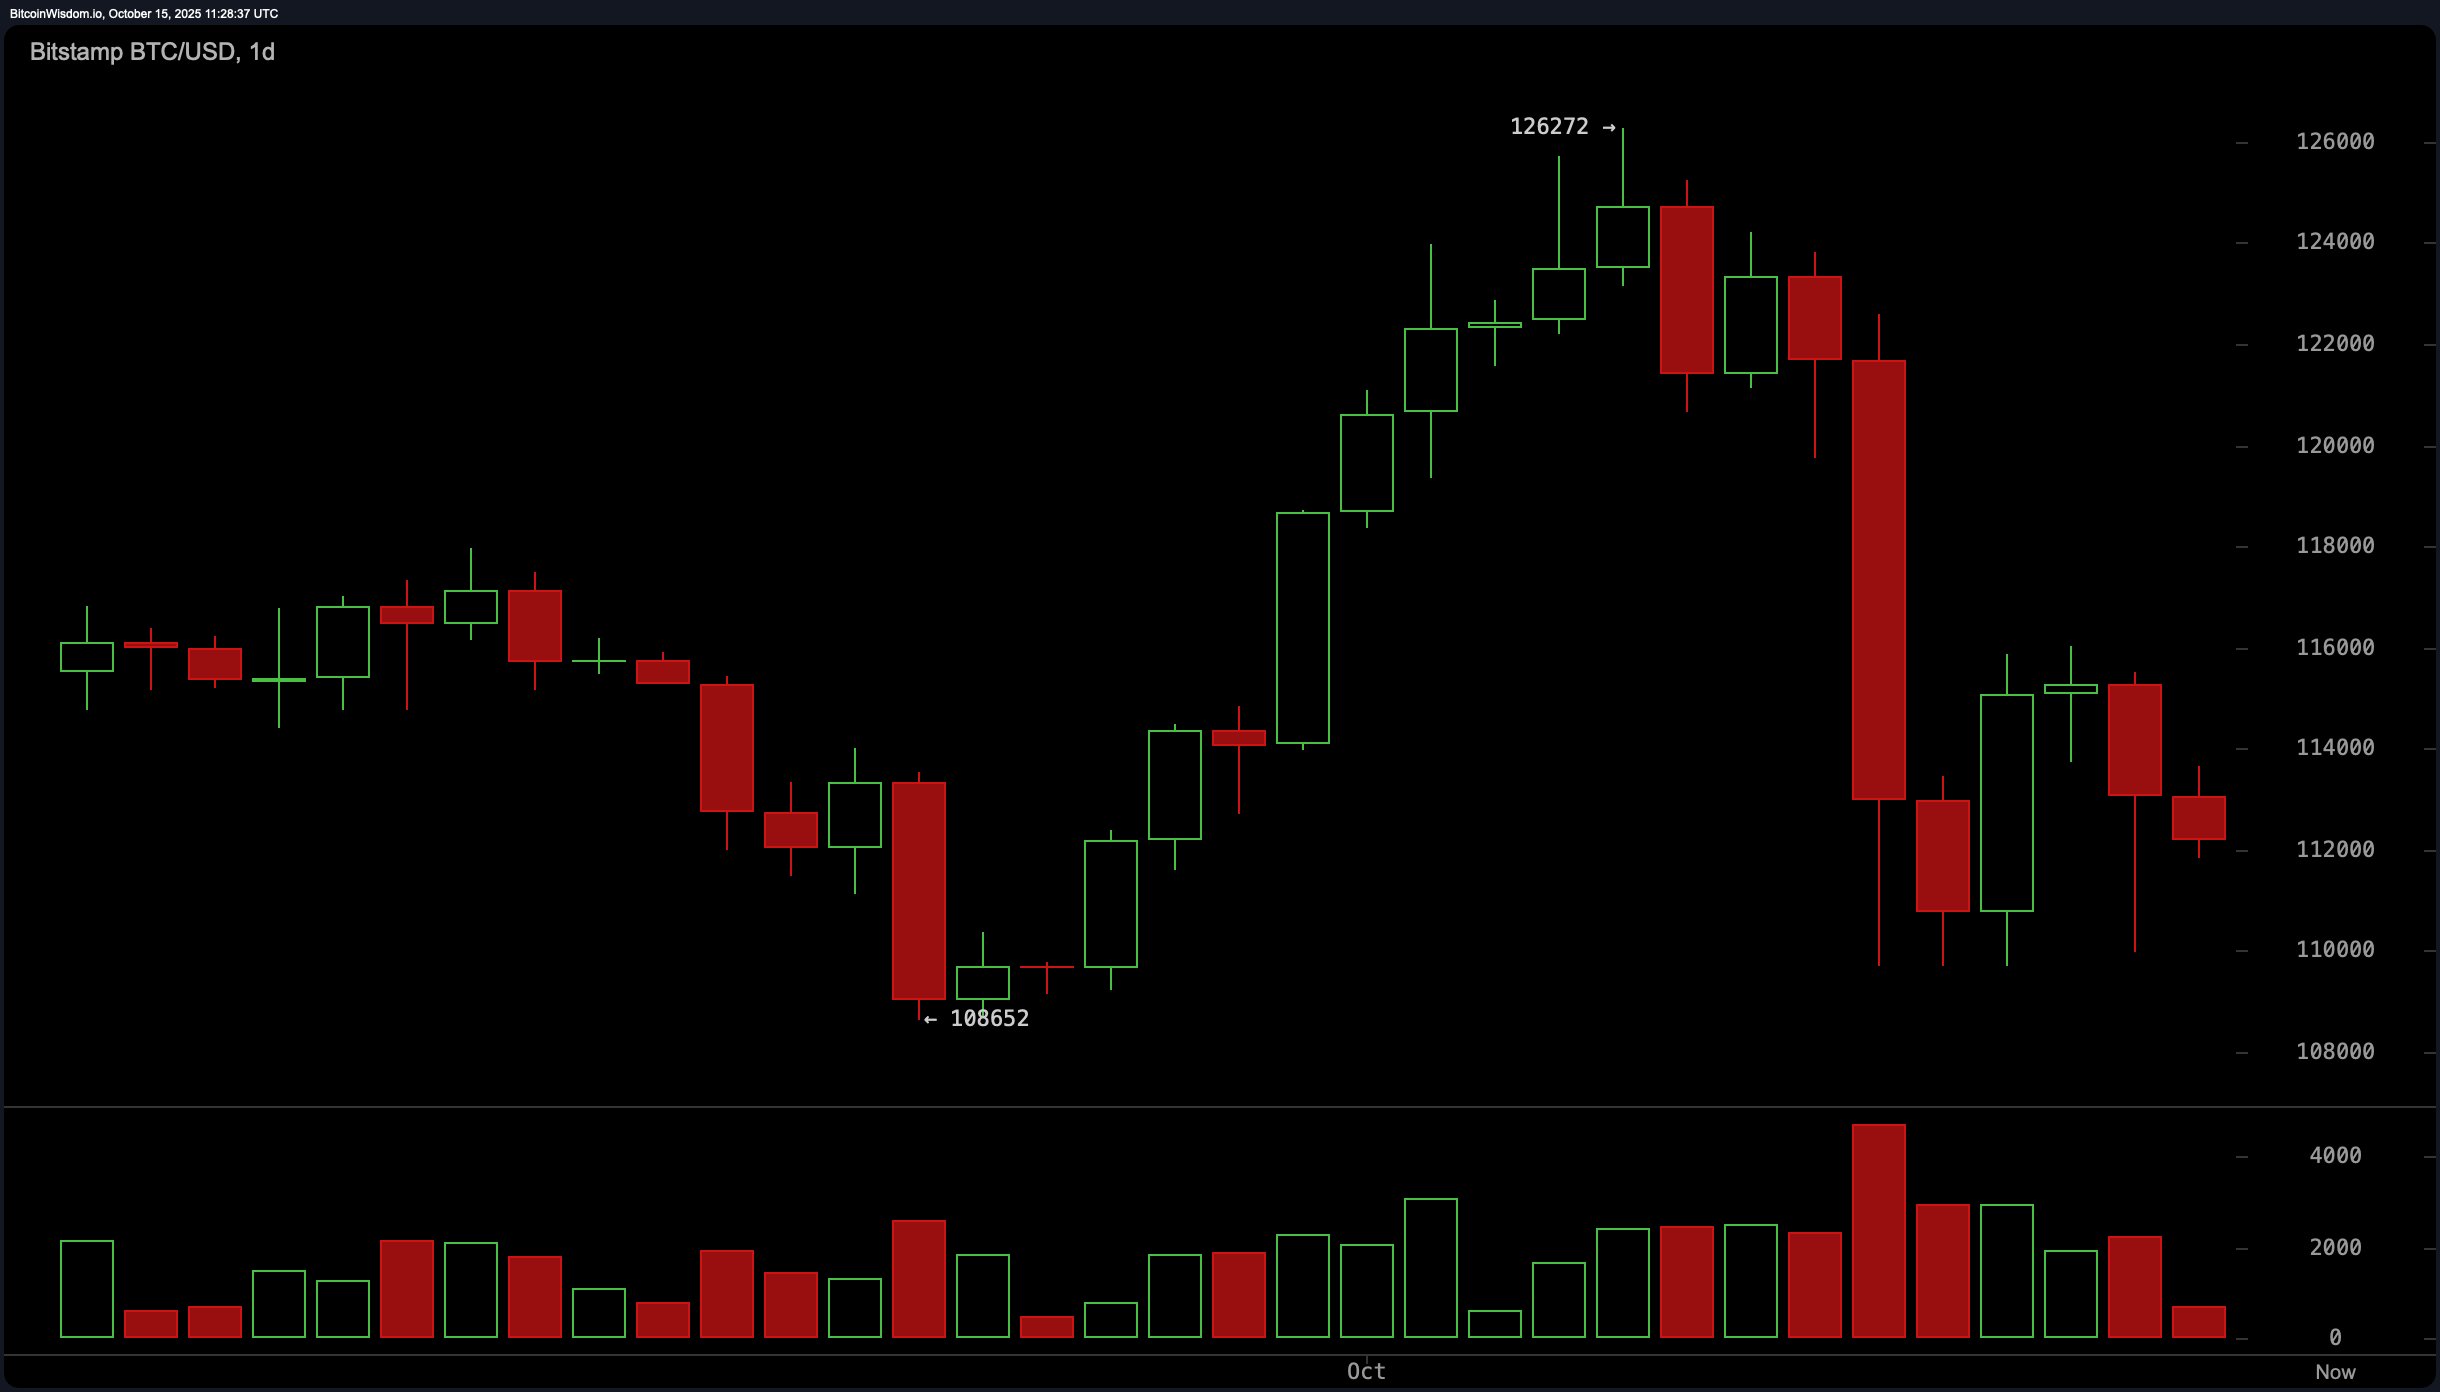
The daily chart’s basically a soap opera: Bitcoin trying to “find itself” after that epic faceplant from $126,272. A parade of red candles, crowned by a dramatic bearish engulfing thingamajig with volume so loud it’s like Godzilla belching, busted it down to $108,652. Tiny recovery attempts? Cute, but about as effective as trying to blow up a balloon with your brain. Couldn’t crack $115,000 if it tried. 🙄
Momentum’s playing hard to get, tilted downhill like a ski slope. All those short-term moving averages – 10, 20, 30, 50, exponential and simple – are lounging above the price, judging it. Volume screamed panic during the drop, but the comeback? More like a whimper. Shrugging my shoulders here. 🤷♀️
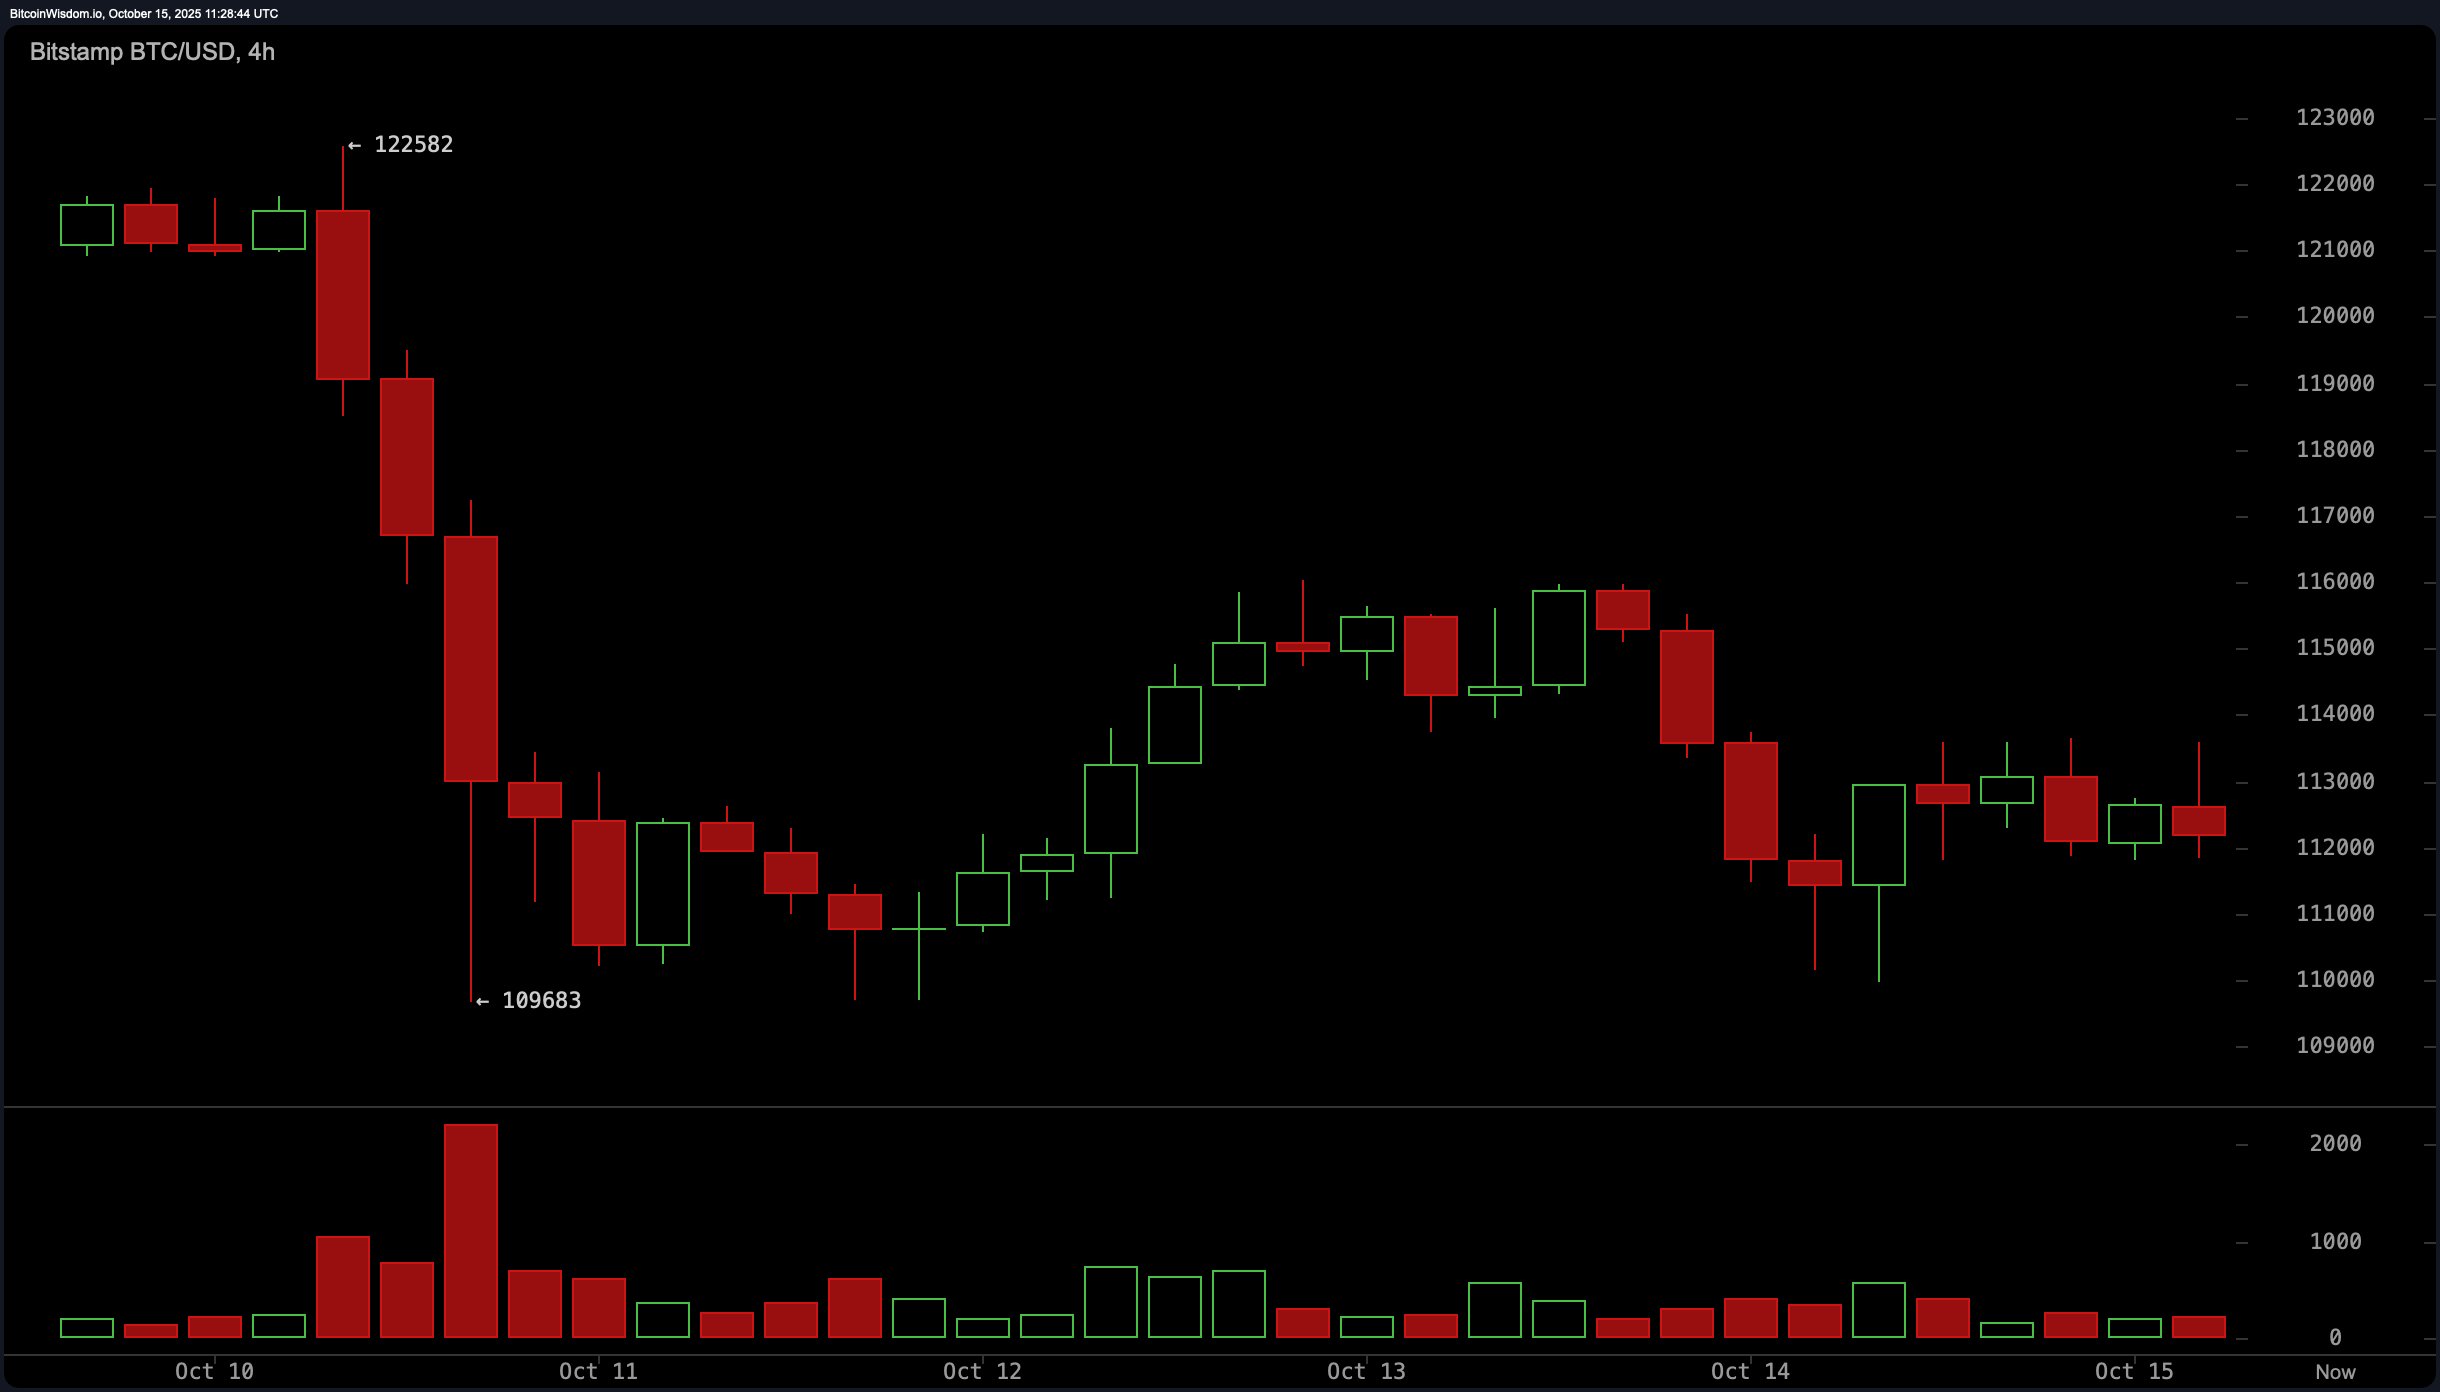
Flip to the 4-hour chart, and it’s a textbook bear flag drama – remember when it tumbled from $122,582 to $109,683? Bounced a bit, then got stuck in $112,000-$114,500 limbo, like a bad date that won’t end. Every jab above $114,000? Rejected faster than a plot twist in a rom-com flop. If it dips below $111,500 with gusto, more downsides await. Volume’s fading like my enthusiasm for this movie. But hey, blast past $114,800 with real oomph, and maybe we’re talking $117,000? Dreams are free… sort of. 📉
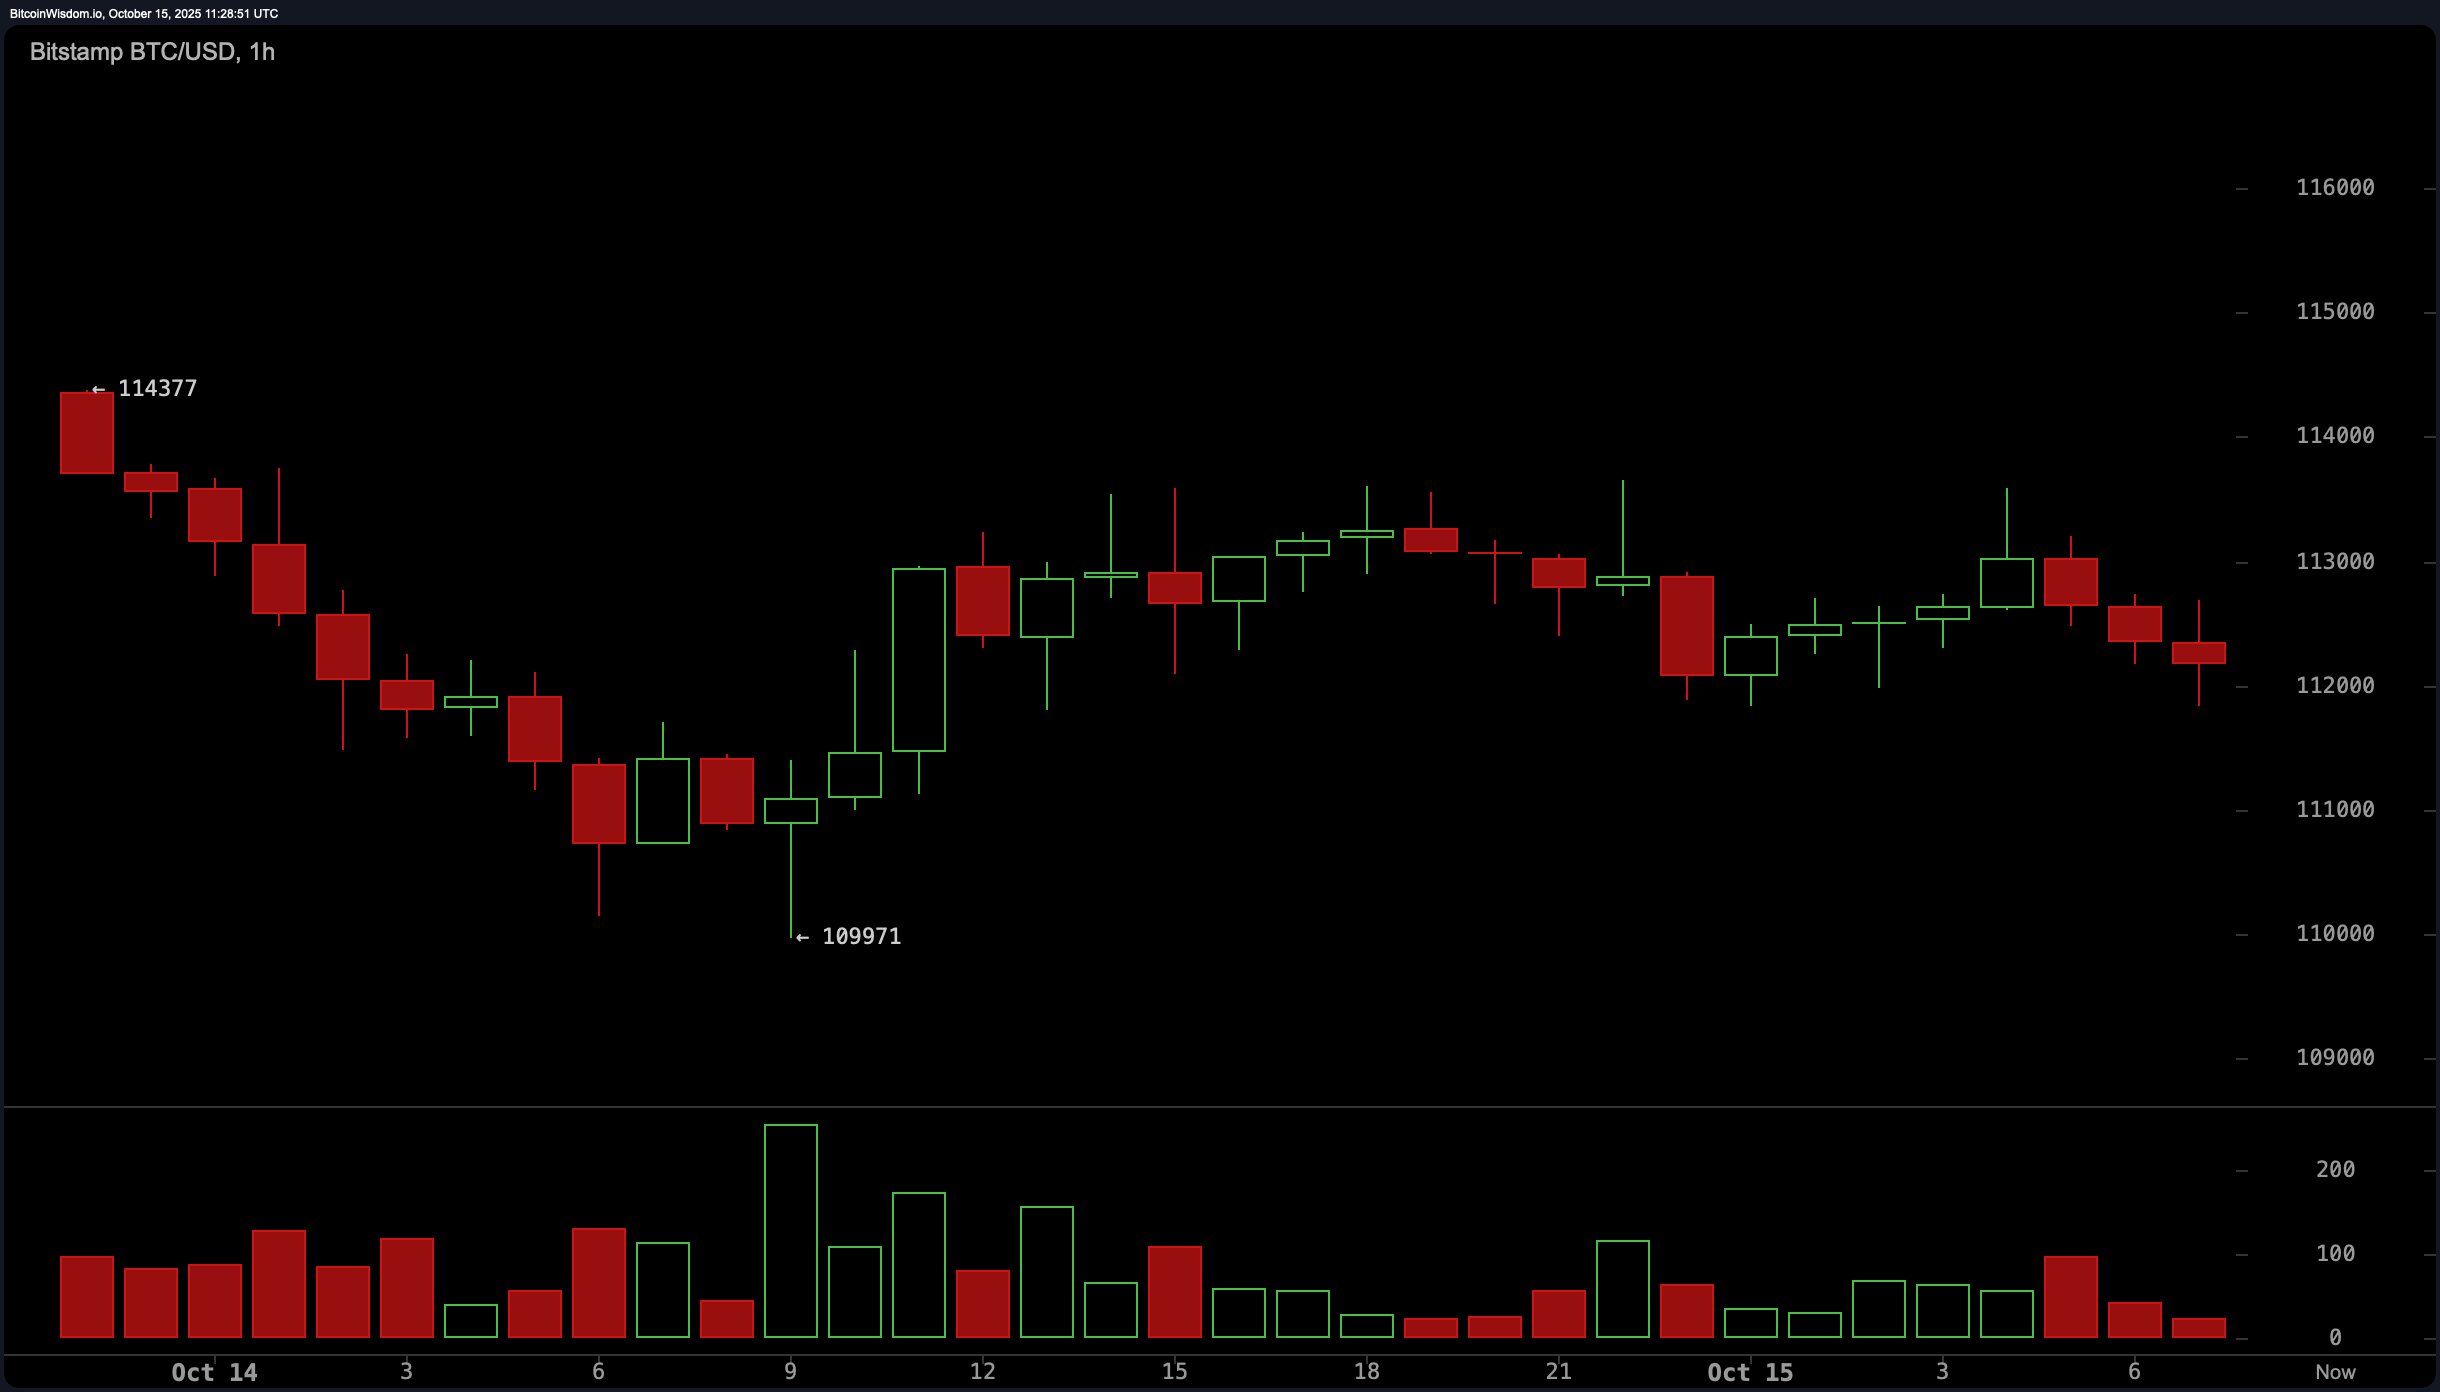
On the 1-hour chart, Bitcoin’s scribbling a micro downtrend – lower highs, volume ghosts. $111,800-$112,000 is its clingy support zone, resistance up at $113,400-$113,800. It’s range trading, squished like a flat soda, waiting for a breakout or breakdown. Fail below $111,500? Bears win this round. Bounce up? Test said resistance, and probably fail hilariously. Traders? Just pretending to care, like everyone at a party they regret attending. 🍺😴
Oscillators are giving off that “meh” vibe, with bearish whispers. RSI at 43? Neutral, like Switzerland. Stochastic at 23? Ditto. CCI at −60, ADX at 25 – all “‘kay.” But Momentum crashed to −11,294, MACD to −254, and Awesome to −3,020? That’s the universe saying, “Girl, no.” Underlying weakness? Aboundeth. If supports crack, it’s tumble town. 🌀
Moving averages are the mean girls of the chart – EMAs and SMAs from 10 to 100 are perched above, pushing down like judgmental aunts. Only the 200s (EMA $108,105, SMA $107,286) are below, whispering long-term hope. Short-term: “You’re a disaster.” Now: “Range-bound with a side of bear drama.” Catalyst? Somewhere over the rainbow, probably. 🌈
Bull Verdict:
If Bitcoin holds above $111,800 and bulls finally grow a pair to smash through $114,800 like a boss, the bear flag might flip to a red flag for bears. Break $115,000-$117,000 steadily? Upward momentum returns, aiming for those old highs. Go, team optimistic! 🐂
Bear Verdict:
Dip below $111,500 on a bullhorn? Bear flags wave triumphantly lower to $109,000 and $108,000. Momentum and MAs are rooting for the grim reaper – unless buyers show up with coffee and courage. Otherwise, adios, amigos. 🐻
FAQ 🧭
- What is bitcoin’s current price?
Bitcoin is trading at $112,121 as of October 15, 2025. (Don’t quote me on that forever – prices change faster than opinions.) 📈 - What is bitcoin’s intraday trading range today?
It’s bounced between $110,456 and $113,537 in the last 24 hours. Like a bad relationship. 📊 - Is bitcoin in a bullish or bearish trend?
Indicators scream short-term bearish with upward momentum weaker than a kitten. Sarcasm: “Nah, it’s thriving!” 🙃 - What support and resistance levels are key right now?
Support at $111,500 (don’t fall asleep there). Resistance at $114,800 (good luck). 🔑
Read More
- Brent Oil Forecast
- Gold Rate Forecast
- USD PHP PREDICTION
- Szabo’s Bitcoin Warning: Don’t Mess It Up!
- Why Bitcoin is the New Water Cooler Topic: Decline, Drama, and Structural Weakness!
- 🤑 Bitcoin, Bills, and Bold Moves: Lummis’s Crypto Revolution! 🌟
- Solana Co-Founder Calls North Korean Hack ‘Terrifying’ – Here’s How They Did It
- Dogecoin ETF Smashes Expectations! 🚀
- Australia’s New Crypto ATM Powers: Will They Ban or Just Be Dramatic? 🤔
- The Curious Case of $921 Million: Will Sentiment Survive the FOMC’s Magnificent Test?
2025-10-15 16:05