Despite overall caution in the crypto market, some meme coins are starting to show positive momentum. Analysts at BeInCrypto have noticed large investors moving funds into these coins, along with promising technical signals, indicating a potential return of interest. They’ve highlighted three meme coins worth keeping an eye on this week.
Coin identification relies on a few things, but the main signals are increasing on-chain activity and positive patterns in the price chart.
Shiba Inu (SHIB)
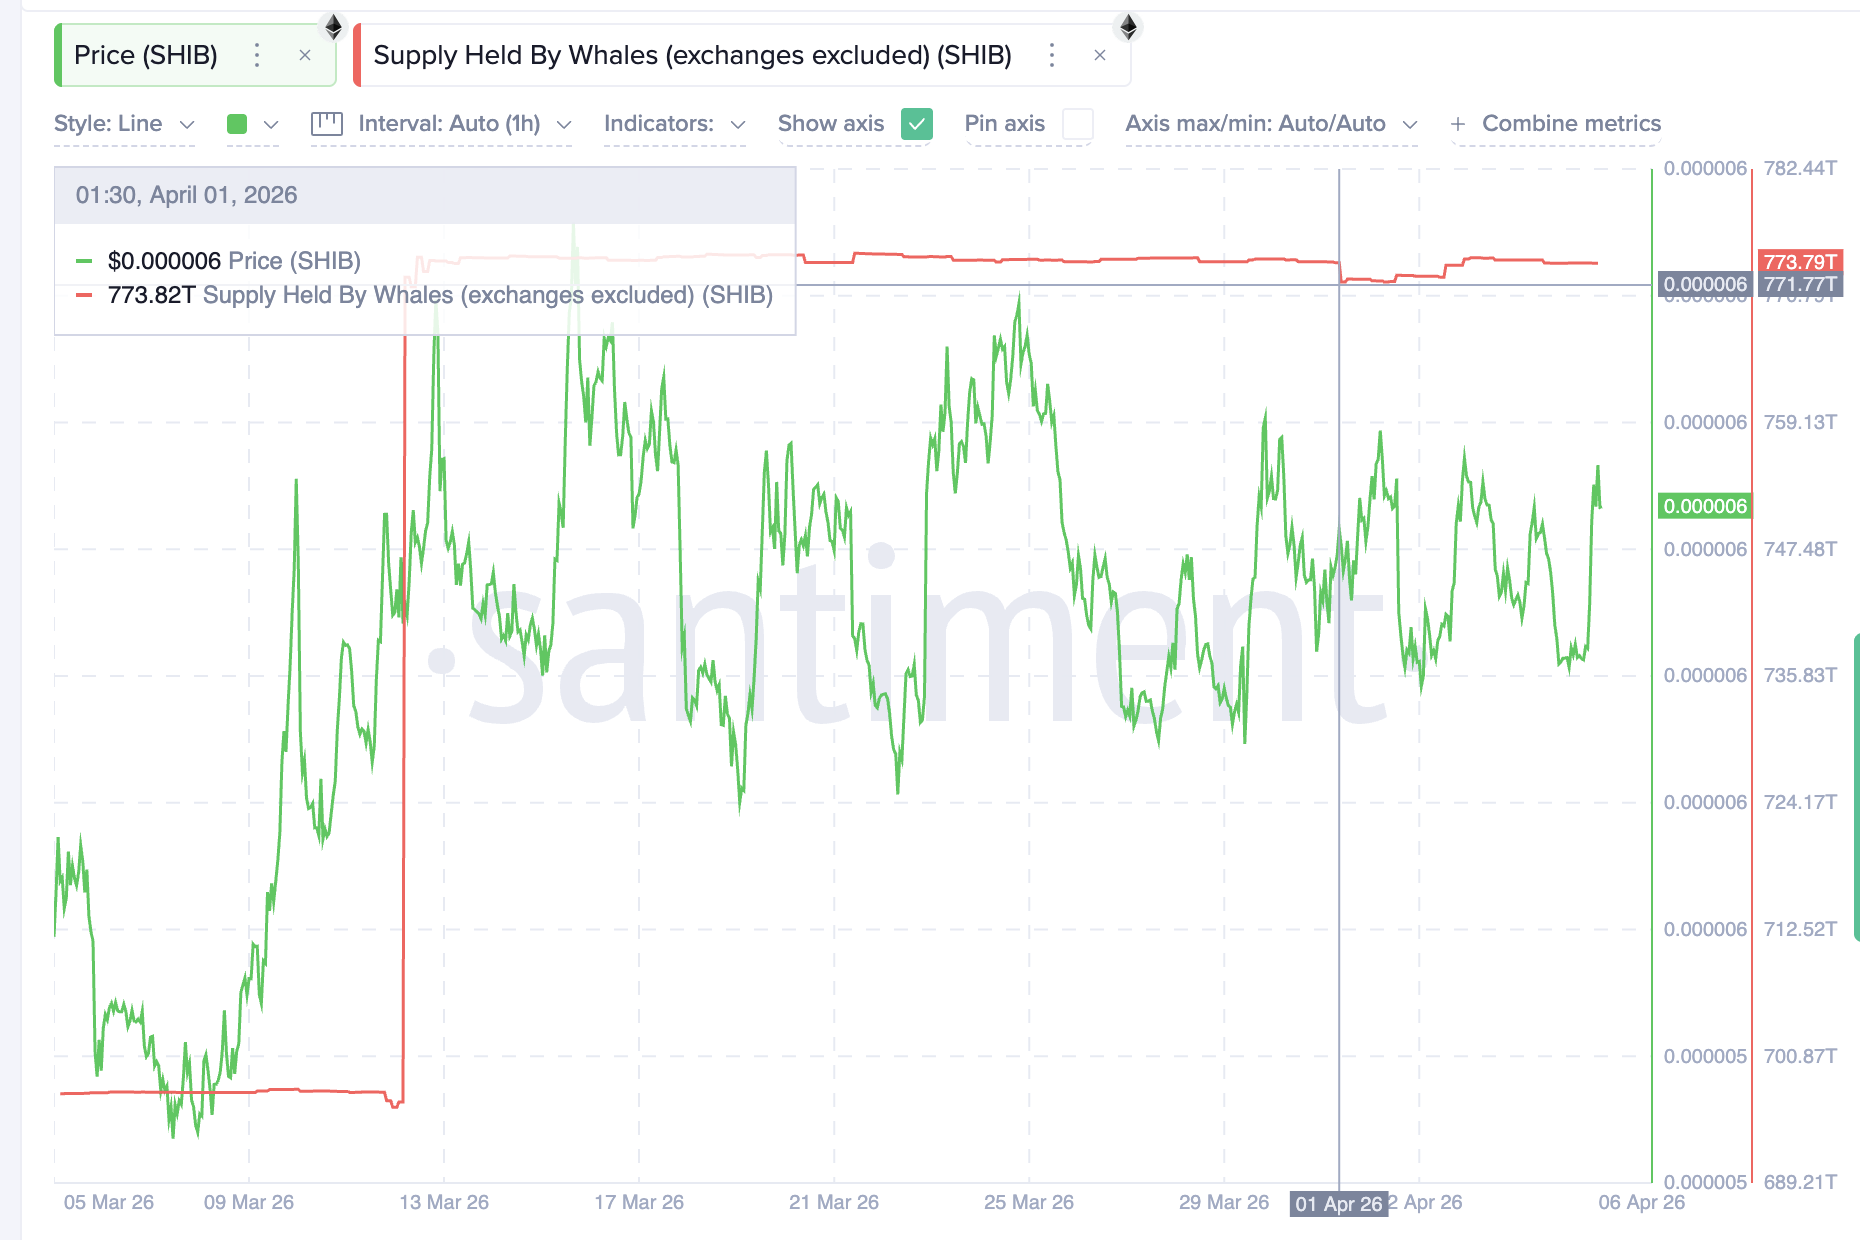
Shiba Inu (SHIB) is currently trading at $0.00000602. While it’s up 11% over the last month, the price is still 13% lower than it was at the beginning of the year. Large SHIB holders, known as whales, have been steadily buying more of the cryptocurrency since mid-March, when there was a significant increase in their holdings, exceeding 771 trillion SHIB. Since the beginning of April, these whales have added another 2.02 trillion tokens—worth about $12.16 million—bringing their total holdings to 773.79 trillion SHIB.
Looking at the daily price chart, there are signs that SHIB might be about to reverse its recent downward trend, and larger investors (whales) seem to be showing interest again. Between January 31st and April 5th, the price hit a new low, but the Relative Strength Index (RSI), which measures how quickly prices are changing, actually went *up* – a typical sign of a potential price increase. This positive signal appeared on April 2nd, and the price briefly rose before encountering resistance at the 0.382 Fibonacci level. Currently, SHIB is trading just above this level, at $0.00000599.
The price is currently facing strong resistance around $0.0000064, which has stopped any upward movement since February 18th. If the price can break above this level, it could then move towards $0.0000072 and potentially higher. Conversely, if the price falls below $0.0000057, it could signal a weakening trend and lead to a further drop to $0.0000052.
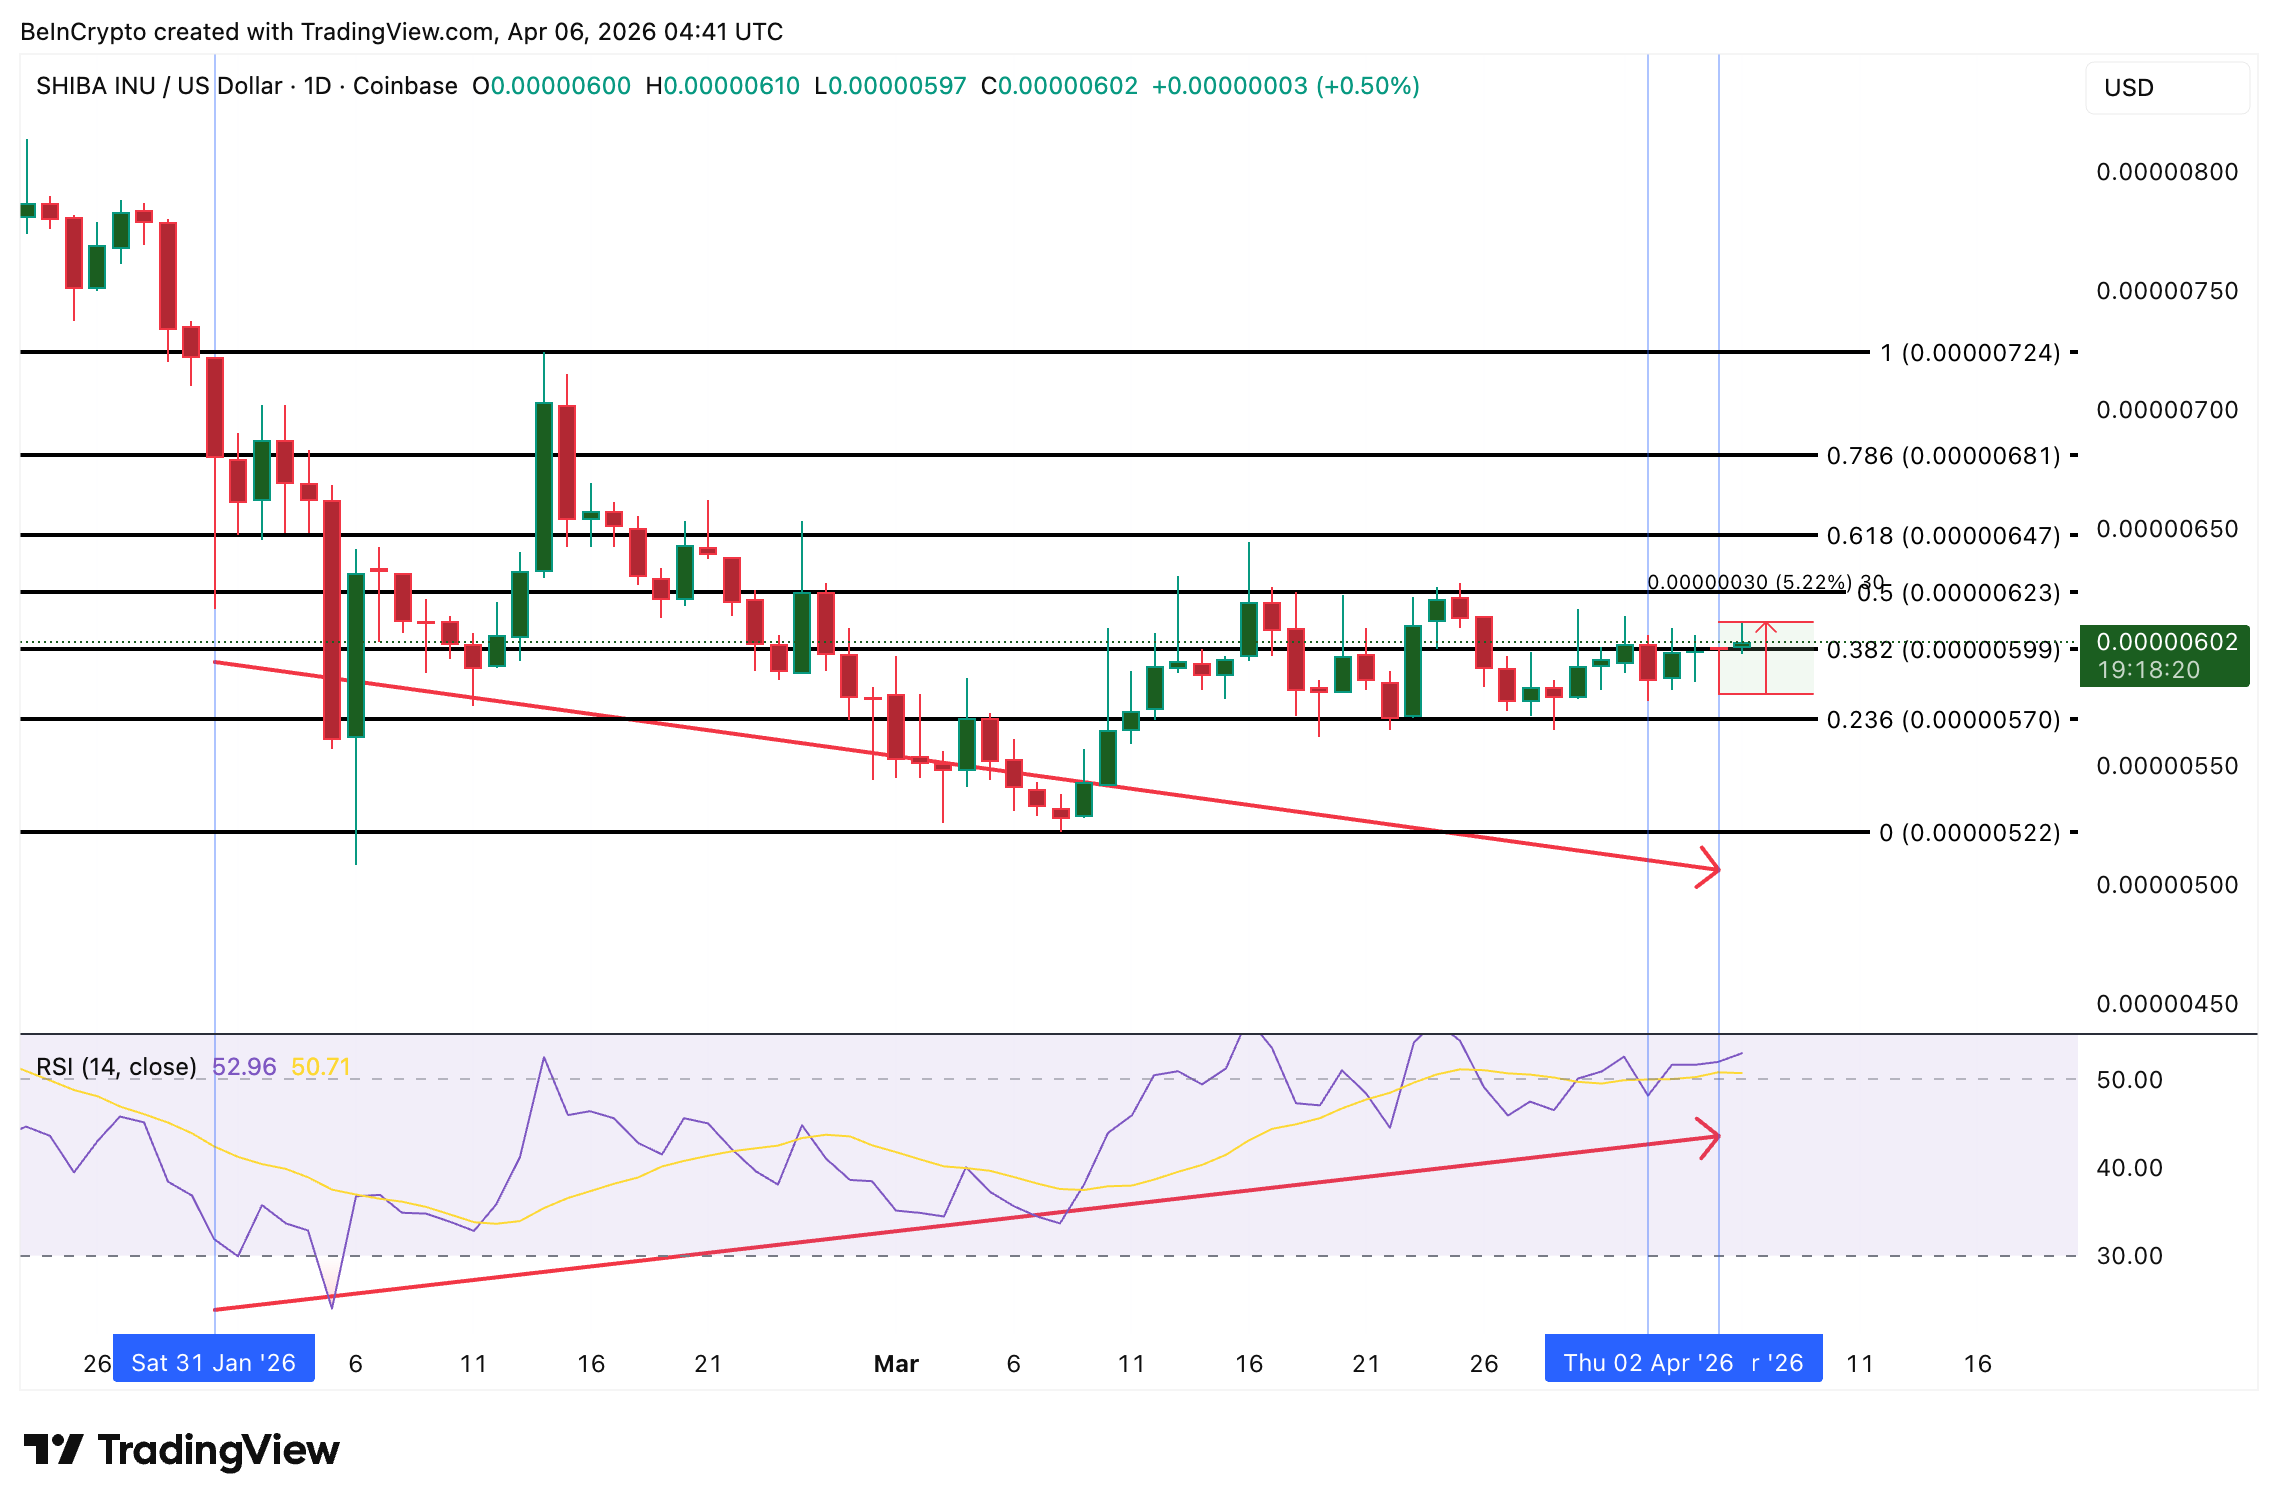
If the price stays above $0.0000064, it suggests strong buying activity from major players. However, if the price falls below $0.0000057, a previously observed positive signal will no longer be considered valid.
SPX6900 (SPX)
SPX6900 (SPX) is currently trading around $0.28, with a 6.51% increase today. This jump follows a claim by crypto personality Murad Mahmudov that SPX is finding support at a similar market capitalization level to where Dogecoin and Pepe previously stabilized before experiencing significant price increases.
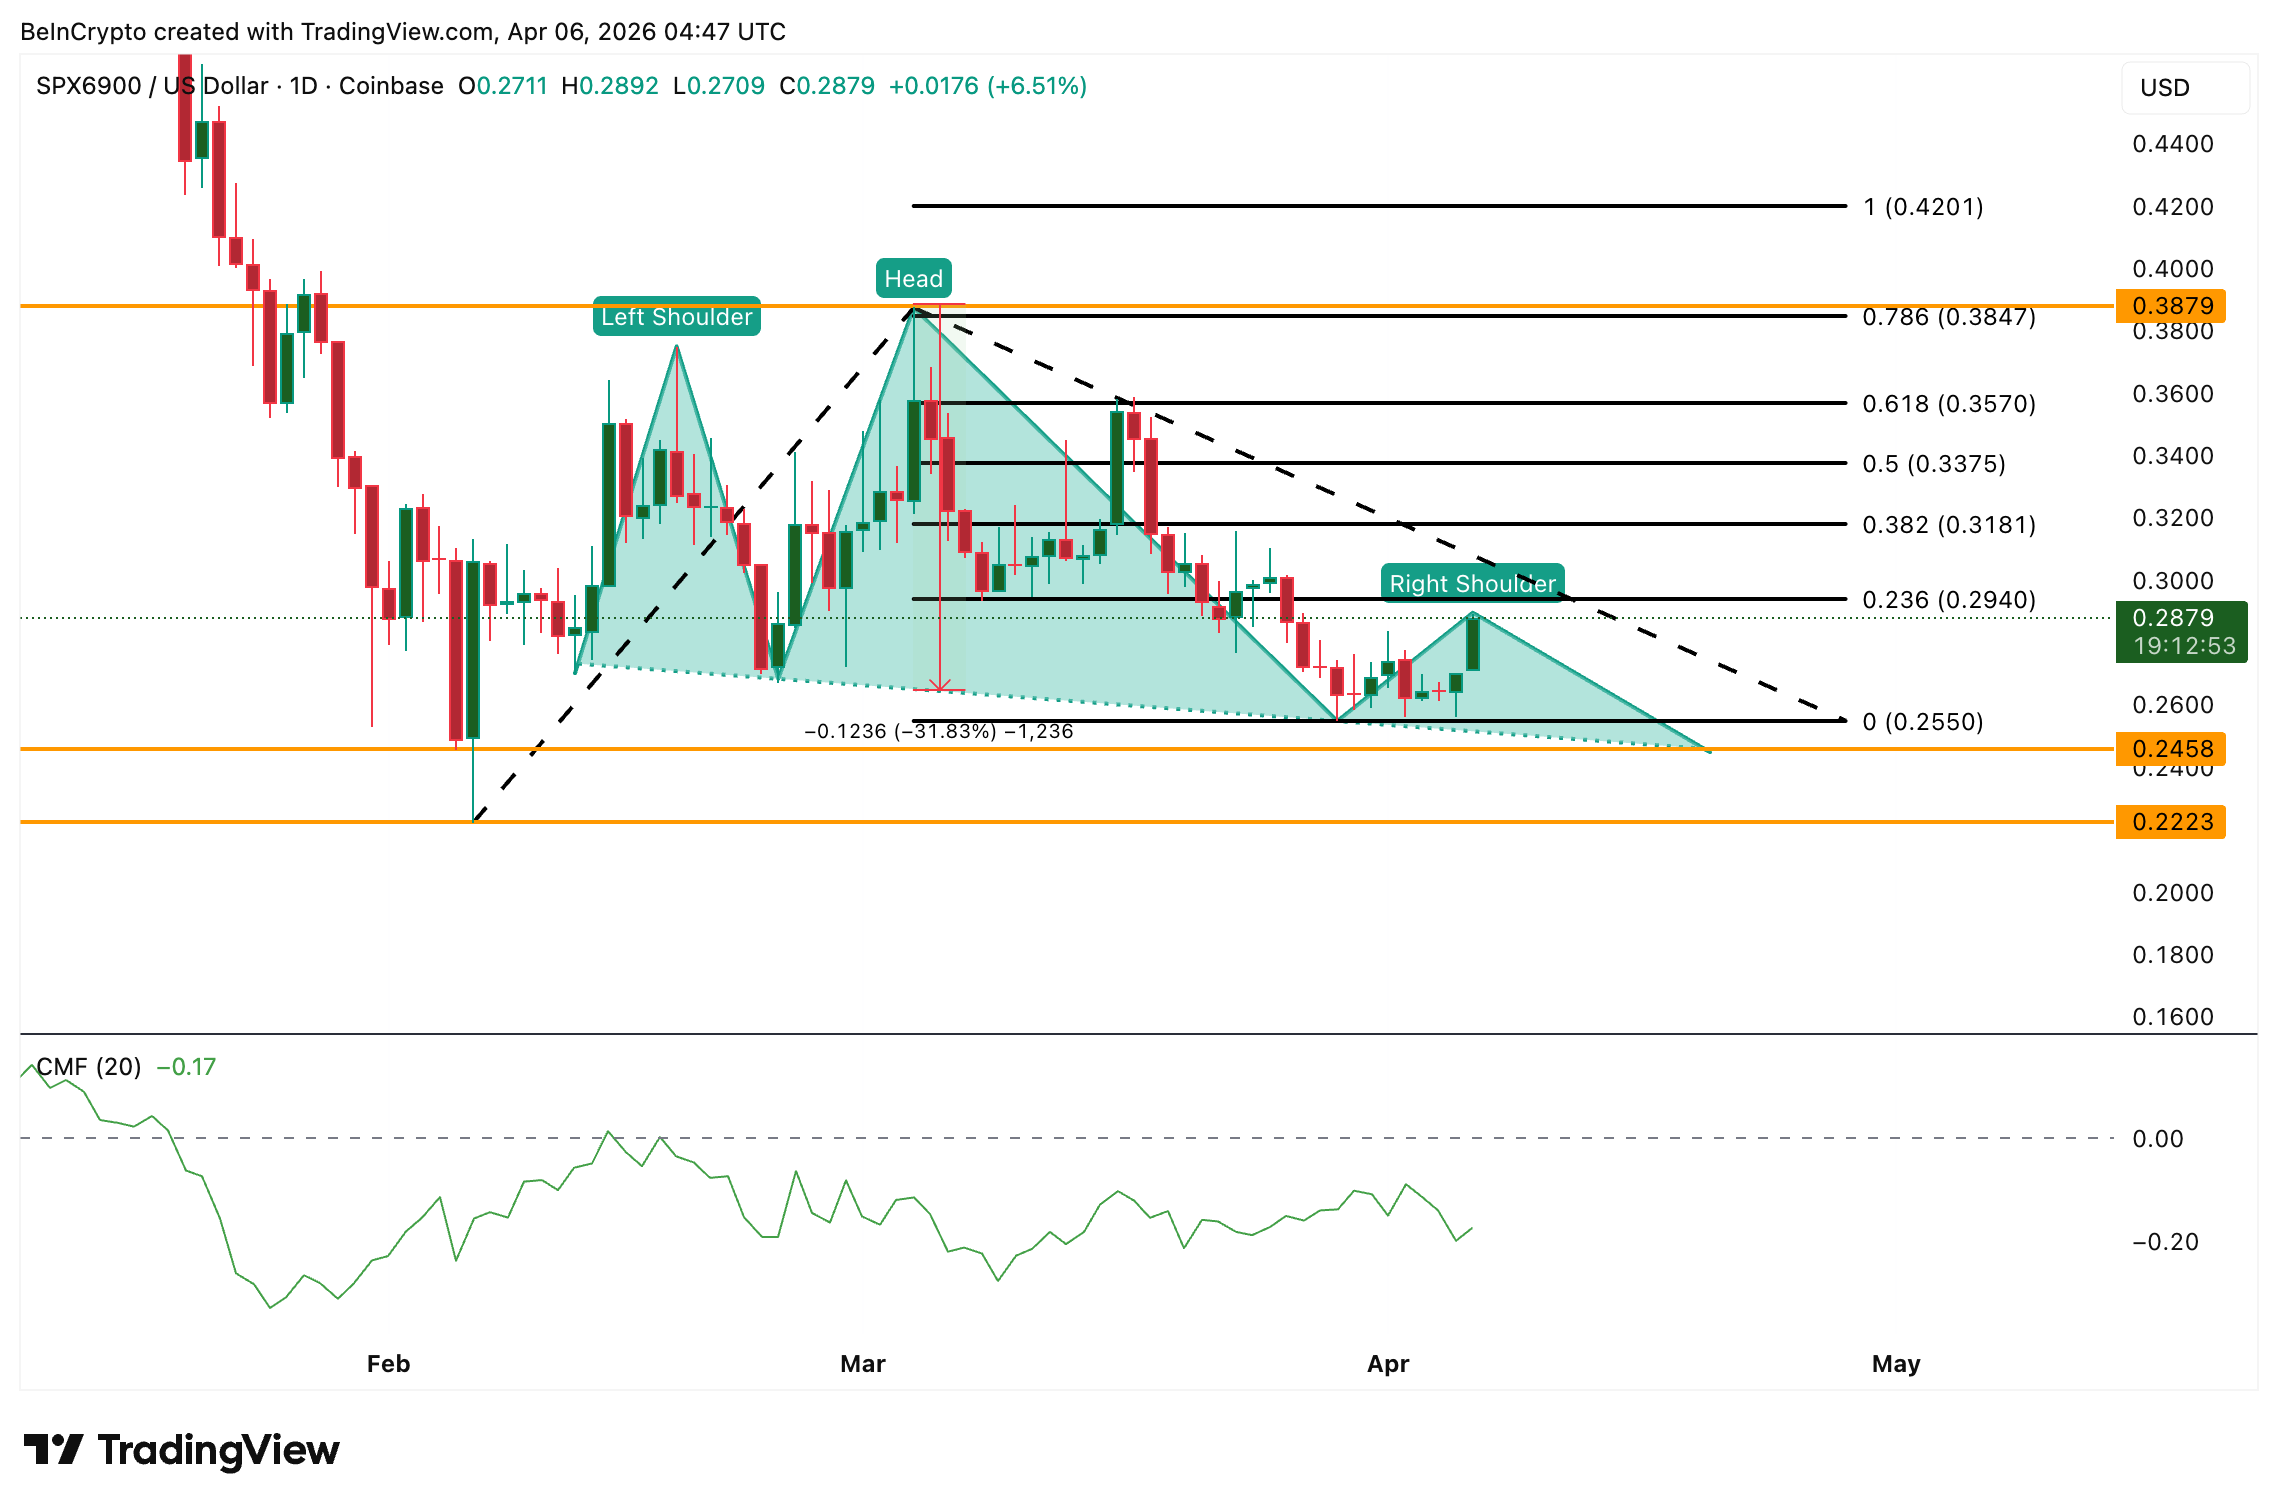
Looking at the daily chart, this meme coin is showing signs of potential trouble. A ‘head and shoulders’ pattern is forming, which suggests a possible price drop. If the price falls below $0.24, it could trigger a 31% decrease from that point.
Chaikin Money Flow, which shows whether big investors are buying or selling, is currently at -0.17 and remains negative. This means that despite the recent price increase, large investors aren’t actively buying. Until this indicator turns positive, any price gains could be temporary and might just be part of a larger downward trend, rather than the beginning of a lasting increase.
Interested in more crypto analysis? Subscribe to Editor Harsh Notariya’s Daily Crypto Newsletter here.
As an analyst, I’m watching SPX closely. If we see a price peak around $0.38 while the Chaikin Money Flow (CMF) remains negative, that would likely confirm a right shoulder formation and reinforce a bearish outlook. To negate this pattern, SPX needs to convincingly break back above $0.35 with CMF showing positive momentum. However, my biggest concern is a failure to hold above $0.29. If it drops below $0.24, breaking the neckline, we could see a significant move lower, potentially down to $0.22 or even lower levels.
If the price goes up to $0.35 and shows positive momentum, it could signal that the predicted downward trend is losing strength. A move above $0.38 would likely mean the downward trend isn’t happening at all. Conversely, if the price falls below $0.24, it suggests a potential drop of 31%.
Pepe (PEPE)
Pepe (PEPE) is currently trading at $0.000003544. Over the last month, its value has increased by 4%, and it’s up another 6% in the past week. Experts are particularly watching PEPE this week, as its recent price movements seem to be supported by both large investor activity and its chart pattern.
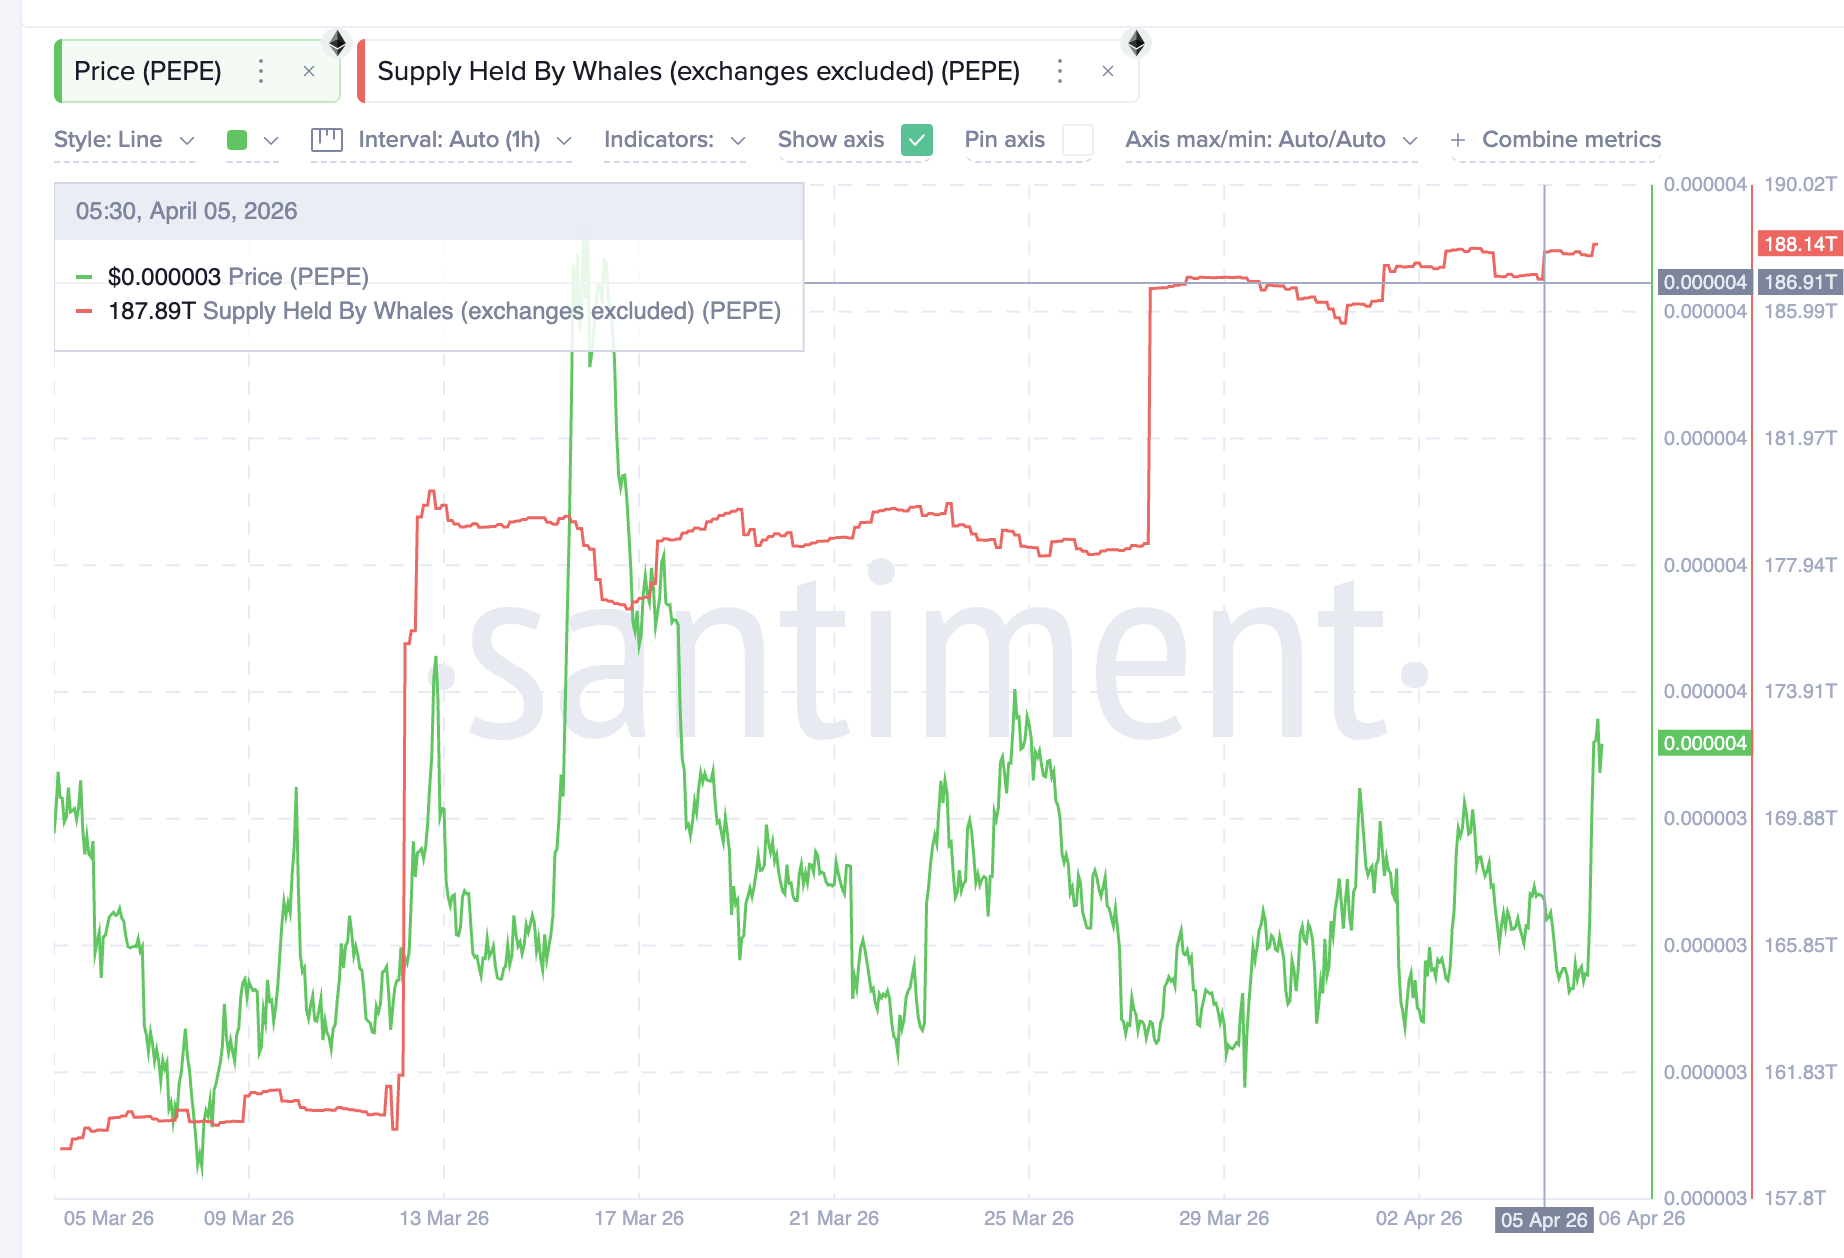
Data from Santiment shows a significant increase in the amount of PEPE held by large cryptocurrency holders (“whales”) on April 5th. Their holdings jumped from 186.91 trillion to 188.14 trillion PEPE, which is an increase of 1.23 trillion tokens – worth about $4.36 million. This appears to be new investment, not just tokens moving between existing wallets, as it happened at the same time the price of PEPE briefly spiked upwards.
The price chart shows a clear change in momentum for PEPE. From February 11th to April 2nd, the price hit a new low, but the Relative Strength Index (RSI) actually went up – a classic sign that the price might soon increase. Since then, PEPE has risen about 11%, and larger investors have been steadily buying more between April 1st and 5th. Currently, the price is above the $0.0000032 support level and is heading towards the $0.0000036 resistance level.
If the price closes above $0.0000036, it would signal a breakout, potentially leading to a rise to $0.0000043. Beyond that, the price could continue upward toward $0.0000047 and even higher. Conversely, a drop below $0.0000032 would suggest a weakening trend and could lead to a fall to $0.0000031 or lower.
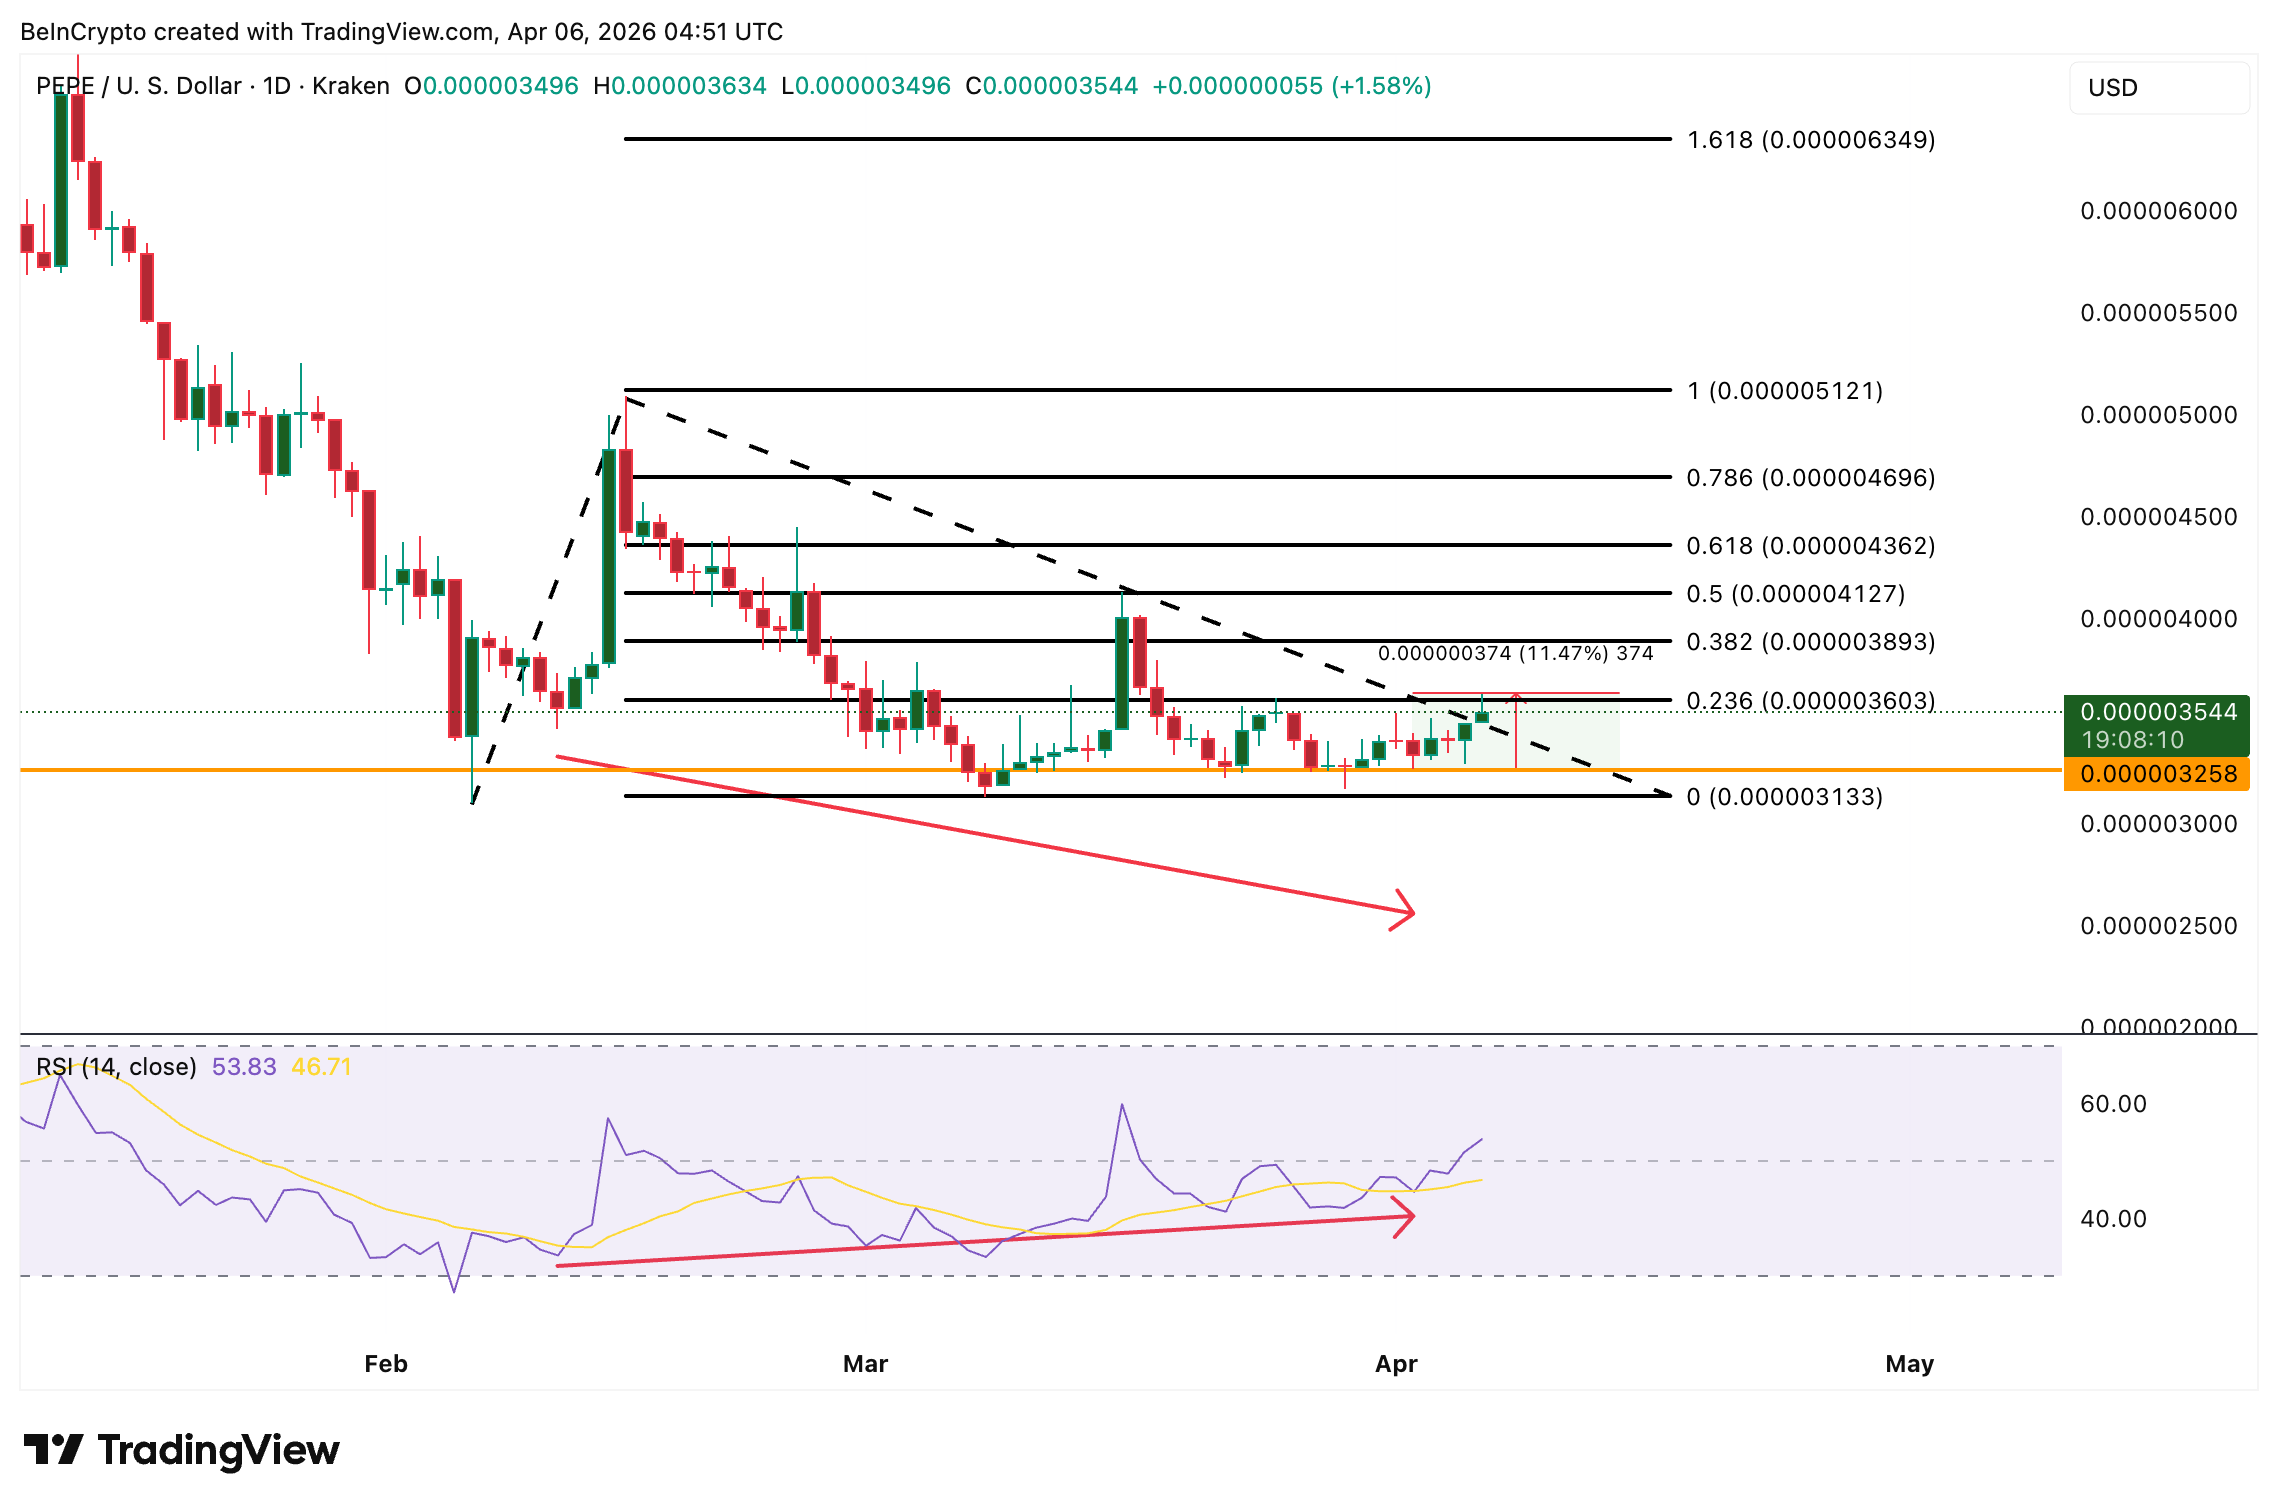
If the price stays above $0.0000036, it suggests the recent price increase, likely driven by a large investor, is likely to continue. But if the price falls below $0.0000032, it would weaken the optimistic signals we’ve been seeing.
Read More
- Brent Oil Forecast
- USD CNY PREDICTION
- Silver Rate Forecast
- CNY JPY PREDICTION
- ETH PREDICTION. ETH cryptocurrency
- DOGE PREDICTION. DOGE cryptocurrency
- USD VND PREDICTION
- EUR USD PREDICTION
- Gold Rate Forecast
- NEAR PREDICTION. NEAR cryptocurrency
2026-04-06 11:33