BNB is currently trading around $618, with investors paying attention to recent coin burns, activity related to exchange-traded funds (ETFs), growing adoption rates, and important price points.
BNB traders are watching the token after a sharp pullback from its recent cycle high.
BNB is currently trading around $618, and analysts suggest factors like token burns, ETF developments, and increasing network usage could fuel the next price increase.
Burns, ETF Activity, and Adoption Claims Shape the BNB Trade
Recent market discussions have centered around BNB token burns and the introduction of new investment options. Some reports suggest that the automatic burning of BNB tokens eliminates over $1 billion in value every three months.
These statements need to be verified using official records of token burns. The post also mentioned the launch of the first 2x leveraged BNB ETF in the U.S.
The product was identified as Teucrium XBNB. Investors frequently monitor ETFs like this one because they can make it easier for more people to participate in the market.
From $300 to $12,000?
One cryptocurrency, often disliked yet widely held, could offer the most significant profit opportunity in the current market cycle.
While people on Twitter debate the merits of Solana and Ethereum, BNB is making significant progress with real-world asset tokenization. This is evidenced by initiatives like BlackRock’s BUIDL, Franklin Templeton’s BENJI, and VanEck’s VBILL.
— Crypto Patel (@CryptoPatel)
The article also mentioned growing use on BNB Chain, reporting 31 million transactions each day and 40% of all global stablecoin trading happening there.
These numbers are currently reported by sources and haven’t been officially verified by network data. Other reports mention tokenized assets on the BNB Chain.
The discussion covered several real-world asset tokens, including BlackRock’s BUIDL, Franklin Templeton’s BENJI, VanEck’s VBILL, and xAUT. It also mentioned examples from Bhutan and how public companies are using these types of assets.
BNB Price Trades Near a Critical Range
BNB is trading near $618 on the daily chart, based on the supplied TradingView data.
The token’s price has dropped from a recent peak around $1,206. This decrease pushed it below important levels identified by Fibonacci retracement analysis.
The chart indicates that BNB is currently being supported around the $600 price point. This means traders are likely watching that level as a potential floor for the price.
The next major support sits near $552 to $560, based on the full retracement level at $552.77.
As a crypto investor, I’m watching to see if the price drops below $552.77. If it does, that could signal a weakening trend and mean the recent gains have been completely erased. But as long as we stay above that level, I think we’re still within a potential recovery phase.
The price is facing resistance between $692 and $700, which also lines up with a key technical level at $692.72. If the price closes above this range, it could signal increasing buying interest.
Read Also:
BNB Holds Key Levels as Analysts Eye $2000 to $5000 Range
Technical Indicators Show a Mixed Setup
Looking at the chart, the MACD is currently a bit negative. The histogram is around -1.61, and the MACD line is trending below its signal line.
The market is showing signs of losing steam, but the rate at which prices are falling seems to be decreasing. Additionally, the MACD indicator is beginning to stabilize after a recent downward trend.
This often occurs when a market shifts from a period of strong selling to a more stable phase. However, the indicator hasn’t signaled a definitive upward trend yet.
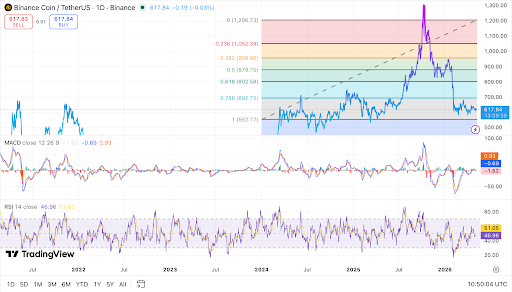
With an RSI of around 47 compared to its average of 51, BNB’s momentum is currently neutral. This suggests buyers haven’t established a strong lead yet.
If the Relative Strength Index (RSI) rises above 50 to 55, it would suggest that the price is starting to recover and that buying interest is increasing, indicating a strengthening trend.
A drop below 40 would suggest that sellers are gaining strength again.
The market currently suggests a slightly negative outlook for BNB. It hasn’t yet broken through the $692 to $700 price range, which is acting as a resistance level.
For the price to start rising again, buyers need to make a move soon. Watching the price around $600 is also key in the near future.
If BNB can maintain its current position, it may establish a stable base. However, if it falls, the price could drop to between $552 and $560.
Read More
- Brent Oil Forecast
- Silver Rate Forecast
- Gold Rate Forecast
- Israel’s Markets Soar Amid War – What’s the Secret?
- ETH PREDICTION. ETH cryptocurrency
- USD PHP PREDICTION
- EUR AUD PREDICTION
- Crypto Chaos: South Korea Says “Enough with the Nonsense!”
- Why Bitcoin’s Biggest Challenge Is Its Own Holders, Not the Market!
- Will XRP Crash Below $1 by 2031? The Dark Side of Crypto Unleashed!
2026-05-03 16:35