Ethereum is currently trading around $2,073. Buyers are hoping to see prices rise and are watching the $2,500 and $3,100 levels as potential indicators of a sustained upward trend.
Ethereum bulls watch $2,500 and $3,100 SMA levels as key triggers for a possible uptrend.
Ethereum is currently holding near a support level, but a lack of strong buying interest is putting downward pressure on the price. If the price can rise above its 50-week and 200-week Simple Moving Averages, it could signal a change in the overall market trend.
Ethereum Faces Pressure Below The 200-Week SMA
Ethereum remains below the 200-week simple moving average, which sits near $2,500.
This price point is now a key test to see if buyers are coming back. If the price goes above this level and stays there, it would indicate increasing demand.
The path for Ethereum to turn bullish requires two triggers:
• Reclaiming the 200-week SMA at $2,500.• A clean break above the 50-week SMA at $3,100.
— Ali Charts (@alicharts)
Ethereum was recently trading around $2,073, according to daily data from Bitstamp. However, the price remains below several areas that previously acted as support levels.
Analysts are now focused on whether the recent price increase will continue. The $2,000 to $2,020 range is a key level to watch for potential buying pressure in the near term.
This price level corresponds with a key Fibonacci retracement. If the price falls below it, we could see further declines.
If Ethereum’s price goes up, it might encounter resistance around $2,500. Some analysts believe this level could hold as a selling point after the recent price drop.
So, buyers need a firm close above it to change the near-term view.
Bulls Need $3,100 Break To Confirm Trend Shift
The next significant price level to watch is around $3,100, which is where the 50-week Simple Moving Average currently sits. Because this level is higher than the current price, it could cause the price to stall or even fall – acting as a resistance point.
If the price rises decisively above this level, it would suggest a stronger uptrend. Recently, Ethereum fell below $3,003.
The price had found support at that level during previous trading. Therefore, breaking above $3,100 would signal a more significant rebound.
Traders are watching this price point closely. If Ethereum doesn’t break above it, any price increases might not last.
Buyers also need stronger volume to support any move above the weekly average.
The move above $3,100 would also place ETH back above a key price shelf.
This could ease some of the downward pressure we’ve seen recently. However, the price needs to continue moving in the direction of any breakout to confirm the trend.
Read Also:
ETH Price Debate Shifts as Corporate Whales Overtake Ethereum Foundation
Momentum Remains Weak As Support Holds
The MACD indicator is currently showing weak momentum because it’s below the zero line and also below its signal line.
Currently, sellers appear to be in a stronger position. The Relative Strength Index (RSI) is around 36, indicating a potential oversold condition as it’s below the 50 mark.
The recent data suggests that while demand isn’t very strong, the market isn’t in a steep decline either. This means we might see some fluctuations before a stable recovery begins.
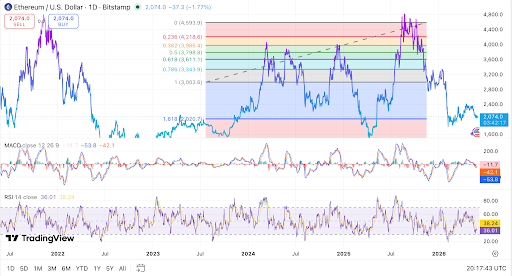
After reaching a recent high, Ethereum’s price started to fall, creating a pattern of lower highs and lower lows. This downward movement, from around $4,600 to $4,800, signaled a shift in the overall trend.
The price couldn’t maintain support at key Fibonacci levels. Ethereum buyers need to see two strong indicators before they can confidently confirm a rising trend.
There are two key levels to watch. The first is a recovery to around $2,500, and the second is a decisive move above $3,100.
Read More
- USD PHP PREDICTION
- USD CNY PREDICTION
- Gold Rate Forecast
- JPY KRW PREDICTION
- GBP CNY PREDICTION
- Brent Oil Forecast
- EUR CNY PREDICTION
- EUR USD PREDICTION
- CNY JPY PREDICTION
- USD MXN PREDICTION
2026-05-27 08:44