Bitcoin is now showing strong bearish signals, according to researcher Axel Adler Jr. This change comes after a significant drop from highs of around $82,500 reached in May.
The cryptocurrency is currently trading slightly above $74,500, which is a key support level. This level also corresponds to the bottom of its 21-day Donchian channel.
A Pattern Taking Shape
Bitcoin has repeatedly failed to move above the $80,000 to $81,000 price level, creating a bearish chart pattern called a head and shoulders.
The recent peak around $78,000 now appears as the right shoulder in a potential chart pattern. Also, the fact that the Relative Strength Index (RSI) is below 50 suggests a lack of buying power during recent price increases, leaning towards a negative outlook.
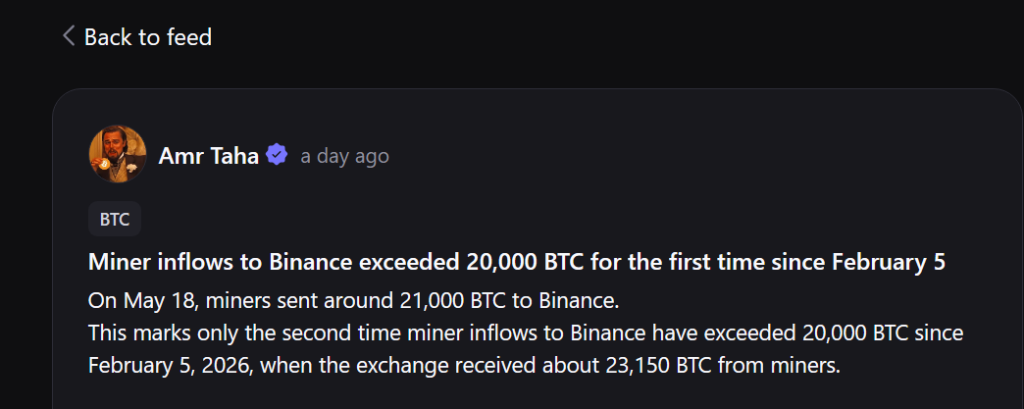
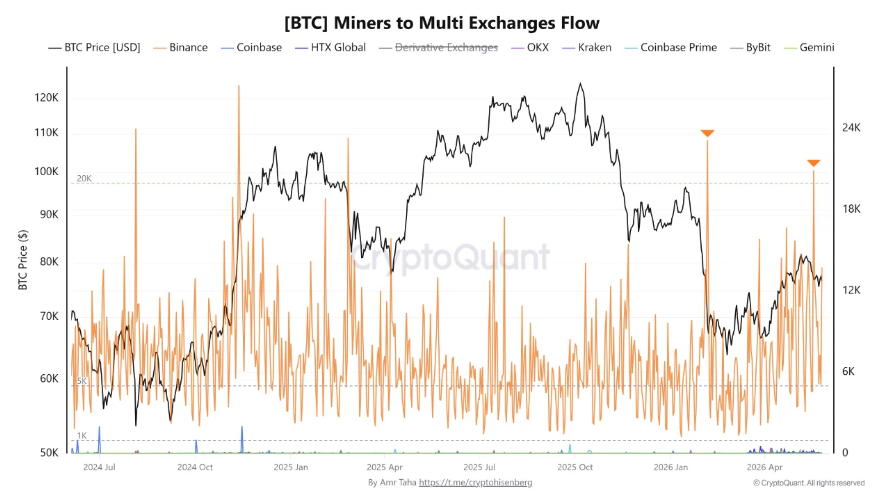
On May 18th, miners transferred approximately 21,000 Bitcoin to Binance. This was the second-largest transfer of its kind this year, following a larger movement of 23,150 BTC on February 5th.
Analyst Amr Taha pointed out that when large amounts of cryptocurrency are moved from mining operations to exchanges, it often suggests miners are planning to sell their holdings to pay for expenses.
Demand Failing To Keep Pace
Even though the amount of Bitcoin available on Binance increased significantly, the price didn’t change much. Binance held around 618,600 BTC on May 6th, and that number grew to almost 634,000 by May 26th, but this didn’t lead to a big drop in price.
A more immediate worry might not be what miners are doing. Data from Glassnode indicates that Bitcoin trading volume is shifting towards selling, following its recent drop from around $80,000.
From my analysis, if we don’t see a resurgence in immediate purchases, the market could easily fall back into the unstable, downward-trending pattern we experienced earlier this year, which kept prices from rising. Essentially, without that demand, sellers will likely continue to control the market.

Currently, profits are only 1.56 times larger than losses, which is significantly lower than the 2-5 ratio typically seen in a strong, rising market. This suggests that recent price increases are only supported by limited and cautious buying.
$75,000 Becomes The Line
Analysts are closely watching the $74,500 to $75,000 price range. According to Adler, $74,500 is a key support level, and technical analysts see this area as a crucial point in the overall price chart.
If the price falls below this point, it could drop to around $70,400. Currently, the price is being supported, but this is fragile due to limited buying interest, increased selling, and a weakening trend.
Read More
- Silver Rate Forecast
- Brent Oil Forecast
- USD CNY PREDICTION
- FIL PREDICTION. FIL cryptocurrency
- ETH PREDICTION. ETH cryptocurrency
- CNY JPY PREDICTION
- Gold Rate Forecast
- USD VND PREDICTION
- EUR USD PREDICTION
- USD MXN PREDICTION
2026-05-29 09:42