Well, look who’s back in the spotlight! Bitcoin, that elusive digital currency, is chilling at $118,598 today. It seems to be enjoying a moment of existential reflection, boxed in a narrow range while traders tap their fingers and await the next big thing. With a market cap larger than the GDP of some countries ($2.35 trillion), and a 24-hour trading volume of $47.75 billion, Bitcoin has been flitting between $117,979 and $120,222. A quiet day in crypto? Or is something brewing under the surface? 🤔
Bitcoin – The Bold and the Bouncing
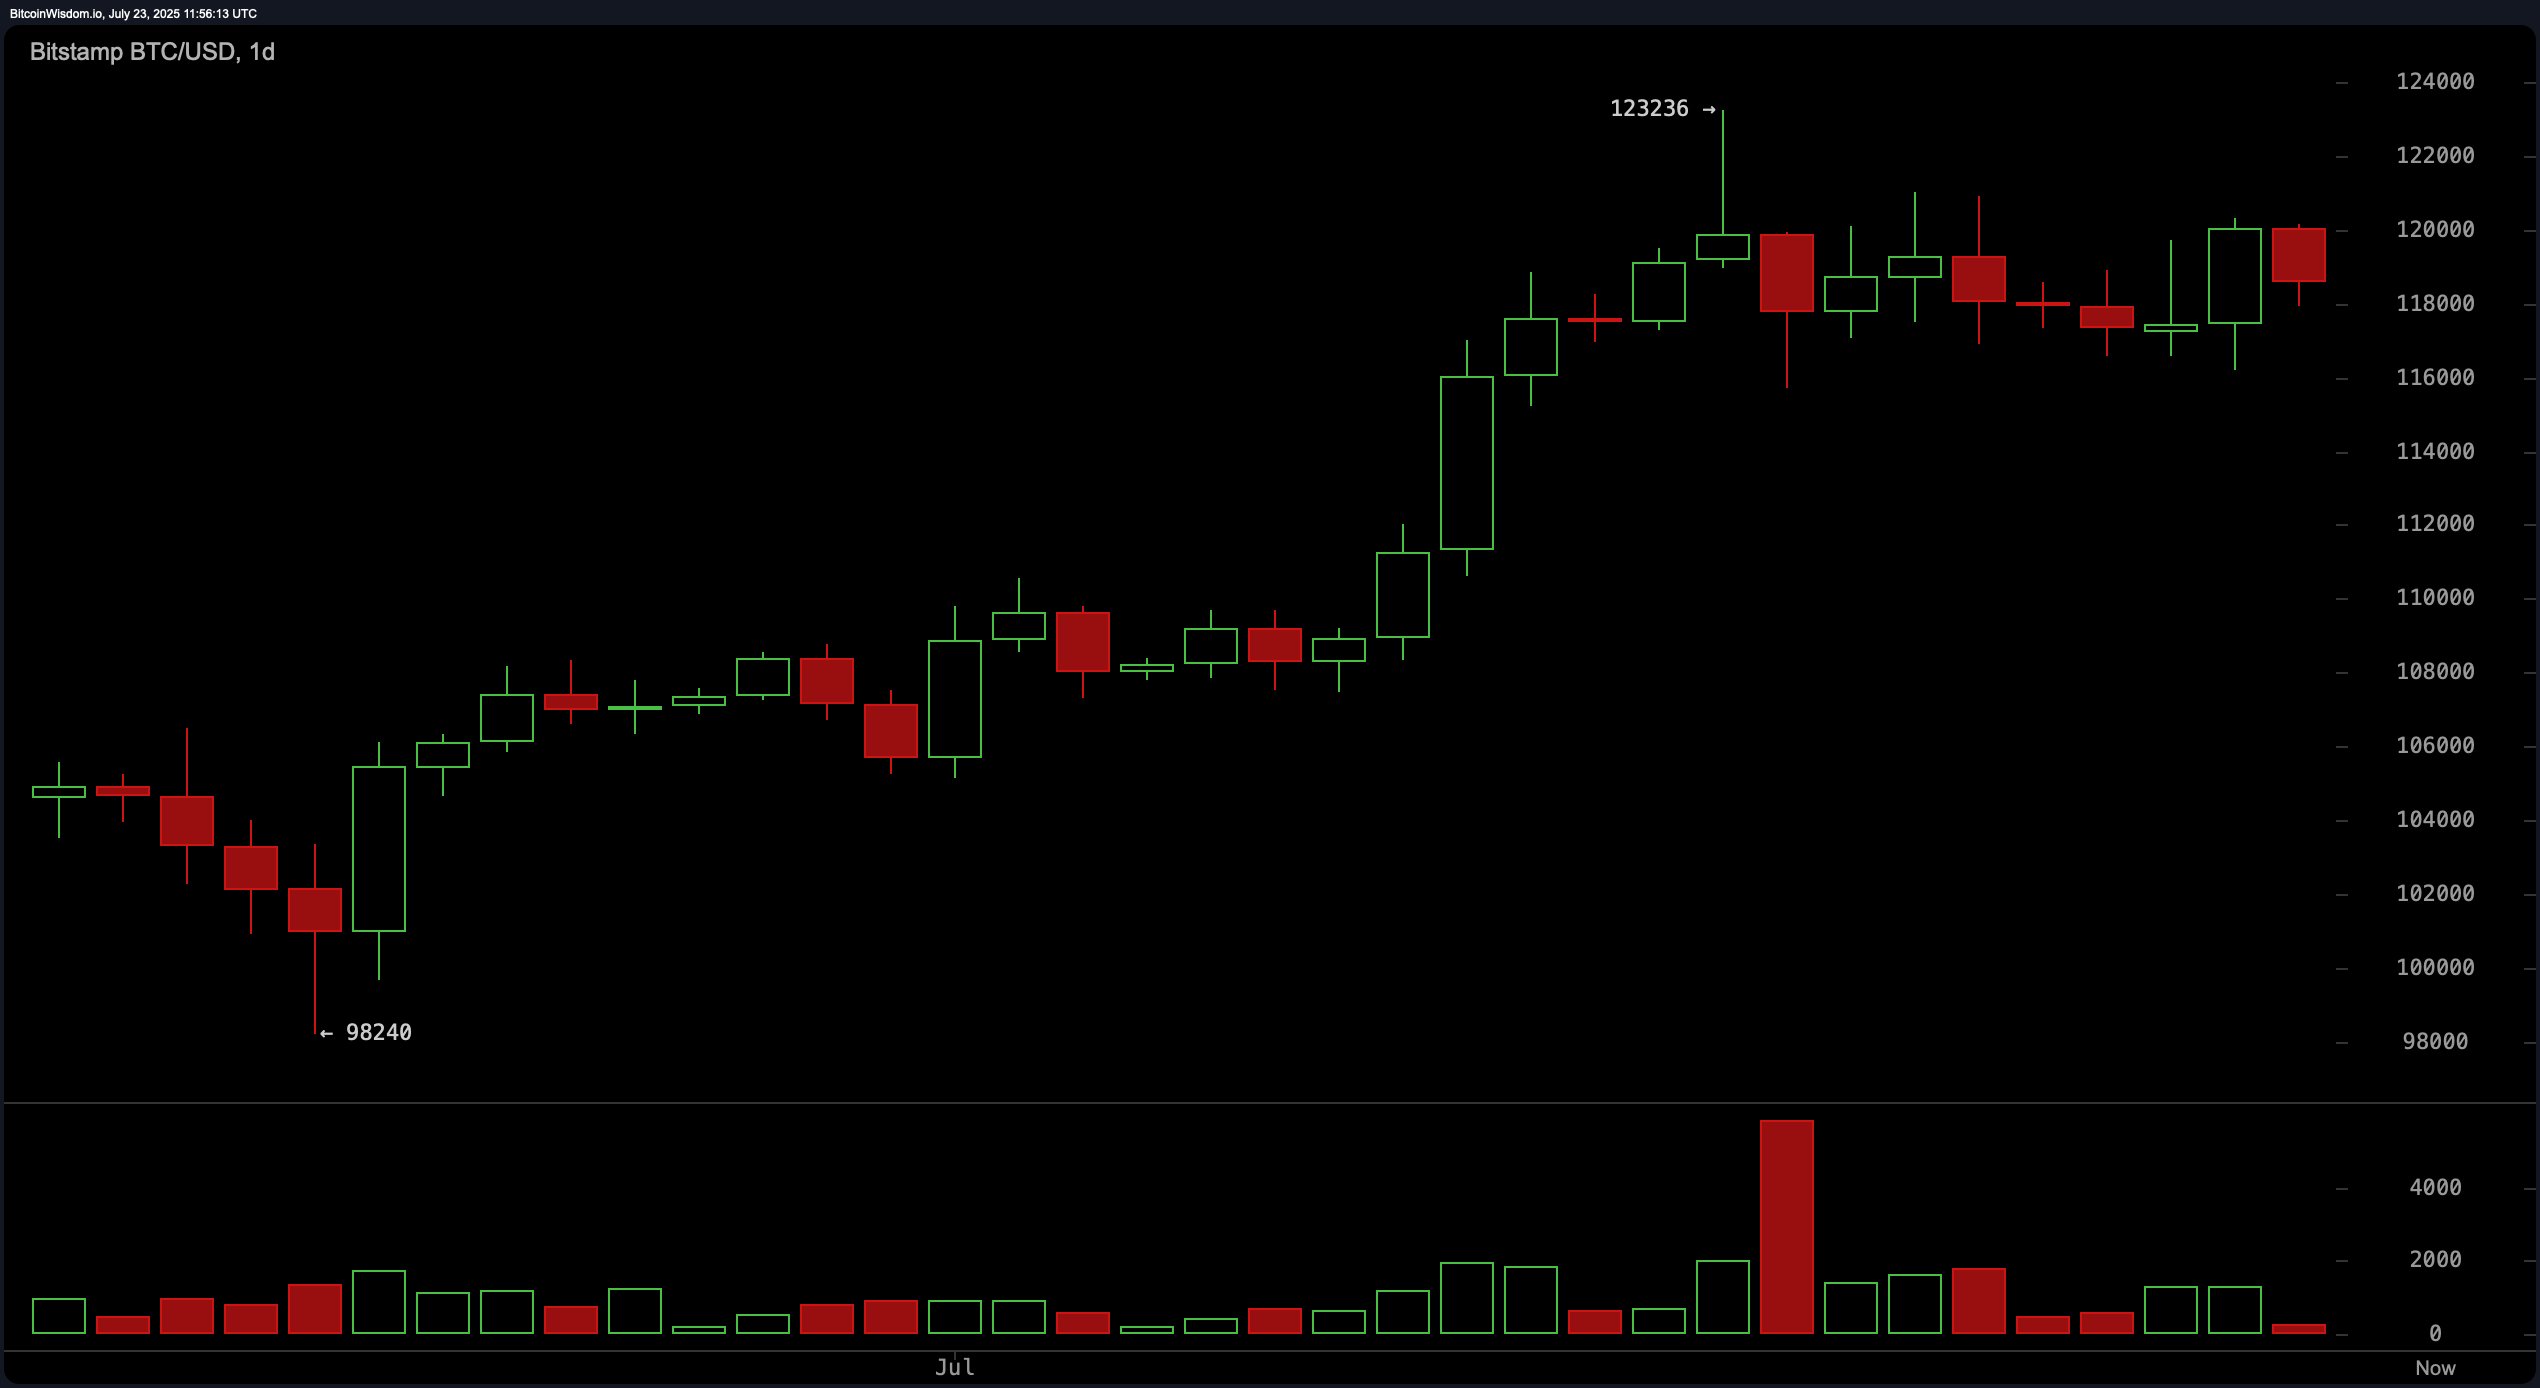
Here’s the juicy part. Bitcoin’s daily chart is a rollercoaster, but don’t hold on too tightly. Since it hit rock bottom around $98,240, it’s been steadily climbing, topping out at $123,236 before settling into what can only be described as a cozy little consolidation range between $117,000 and $121,000. Seems like Bitcoin is catching its breath, maybe sipping a virtual coffee, preparing for the next big move. A big surge of bullish volume was spotted right before it peaked, but is it exhausted? 😴
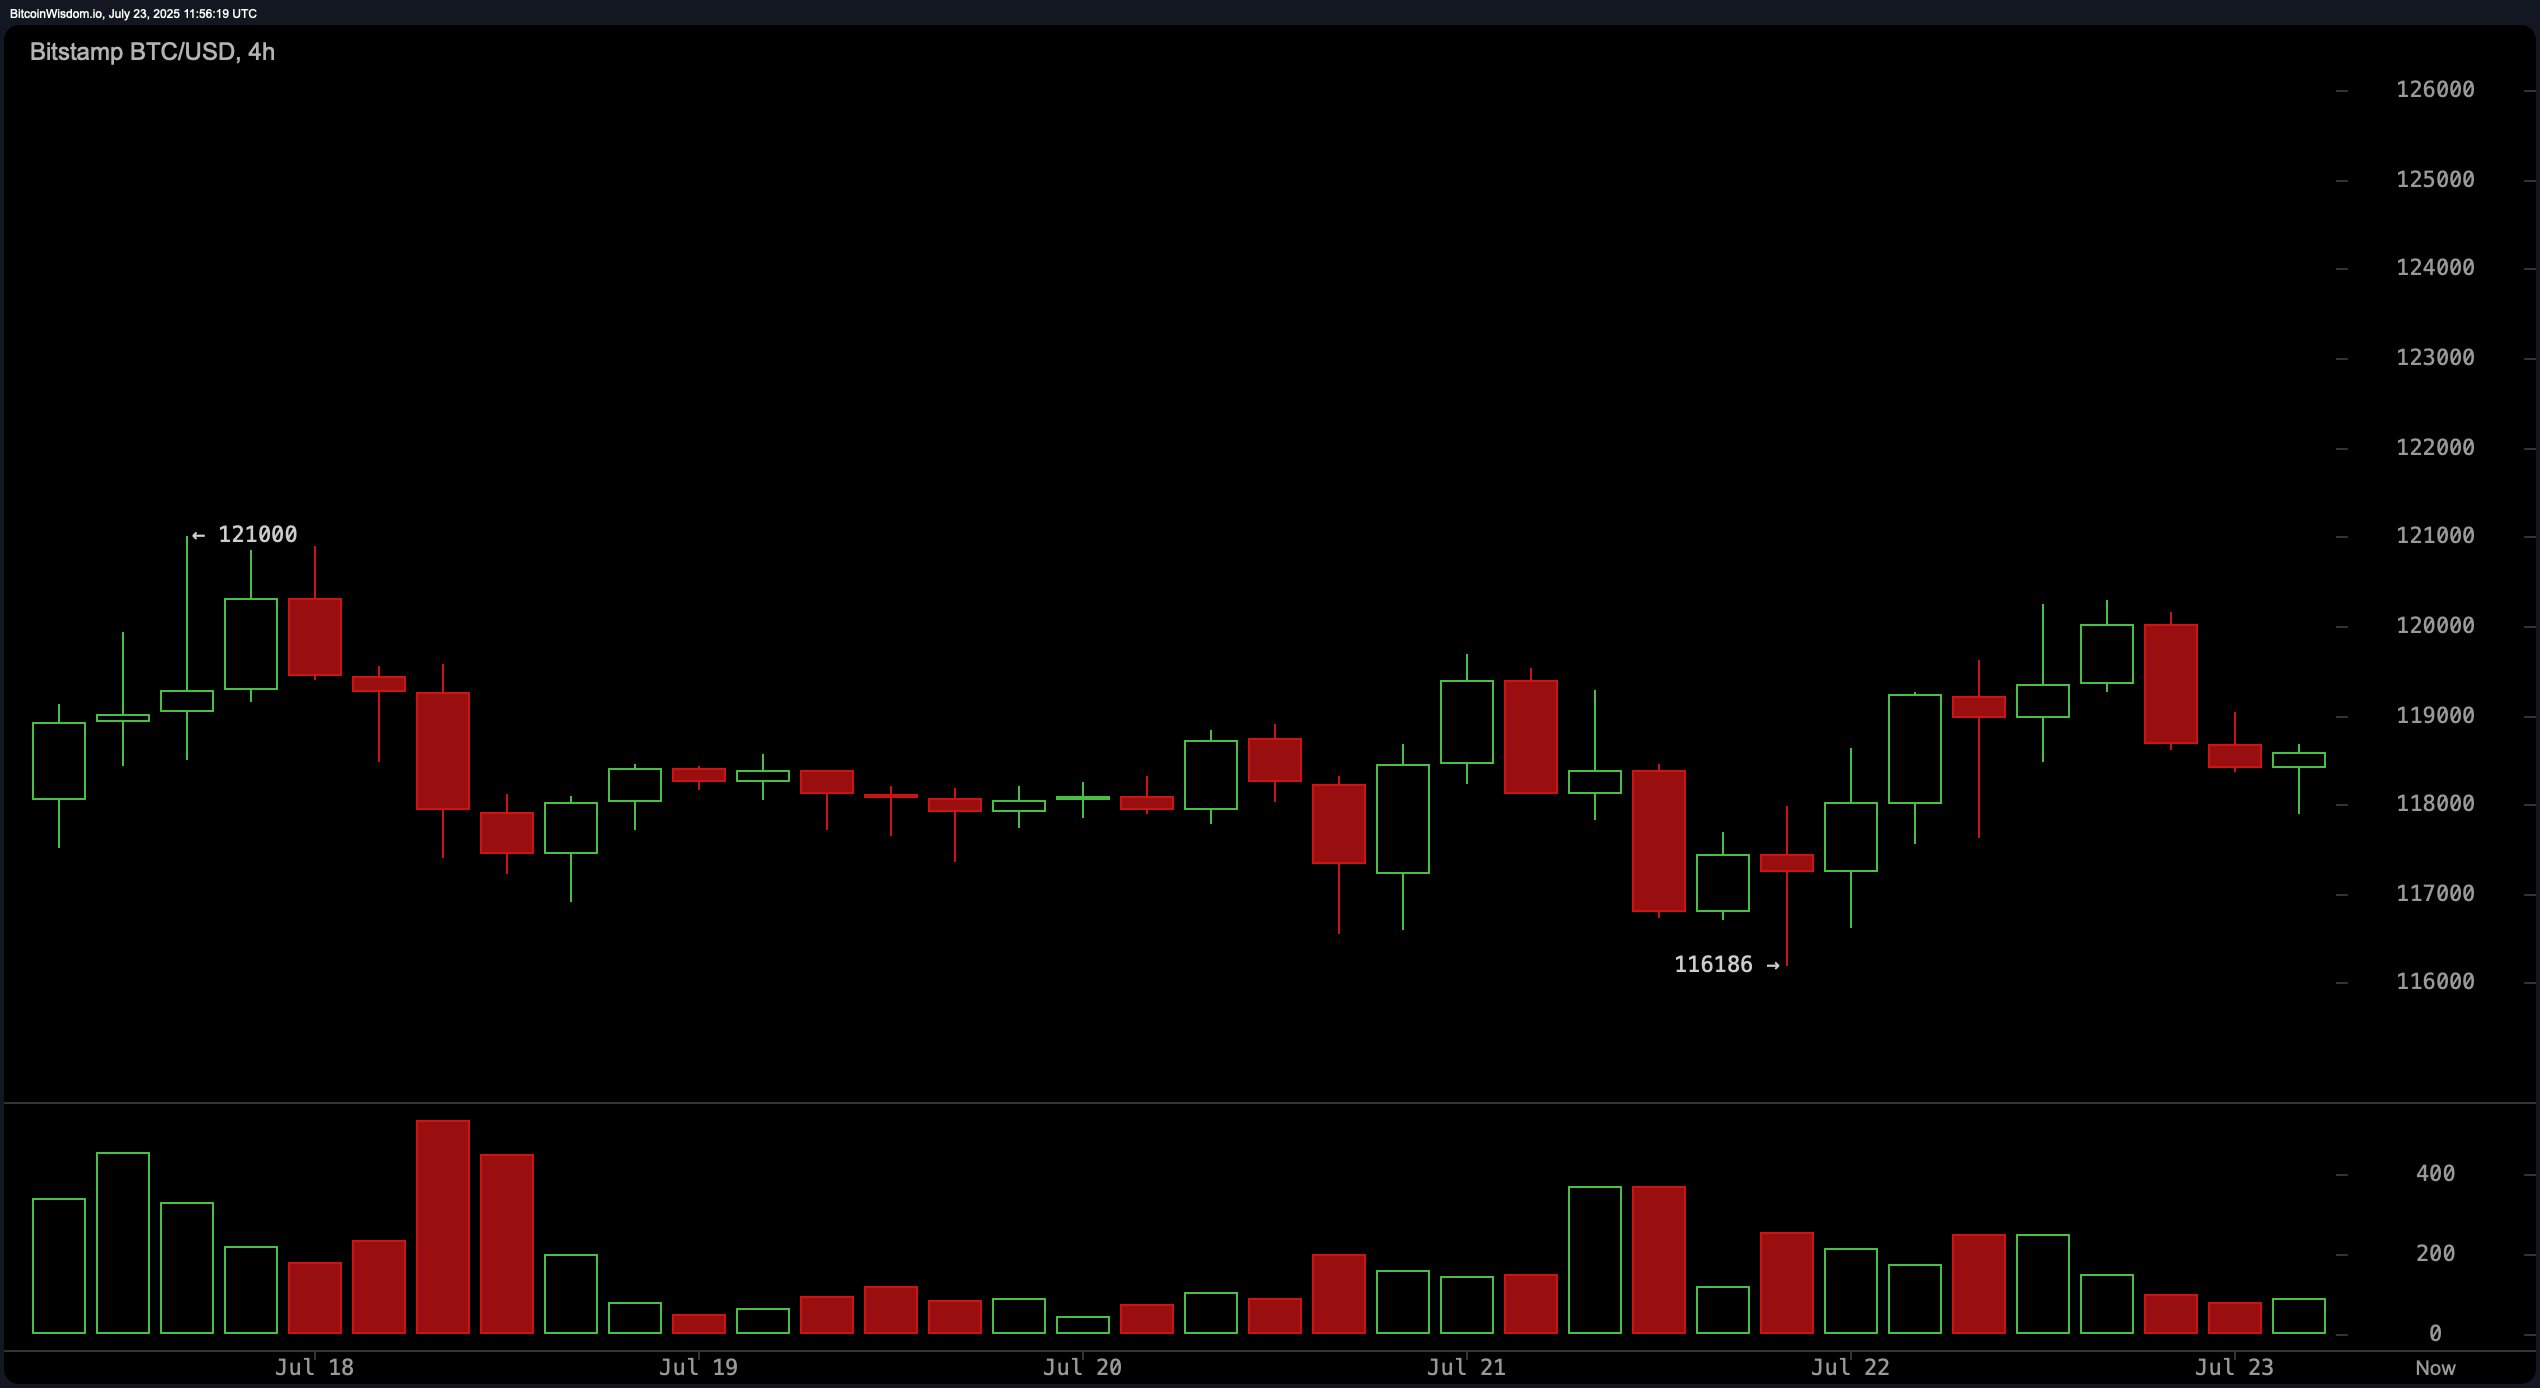
Let’s zoom out to the 4-hour chart, shall we? Bitcoin tried to break free at $121,000, but got slapped back to $116,186. Ouch. And now, there’s a pattern of lower highs, signaling that the bulls might be losing steam. Is Bitcoin in the midst of a midlife crisis, or is it just tired? Whatever it is, the $116,000–$117,000 range is like that awkward moment at a party where no one knows whether to leave or stay. Buy the dip? Maybe, but let’s not get too excited without some volume confirmation. 📉
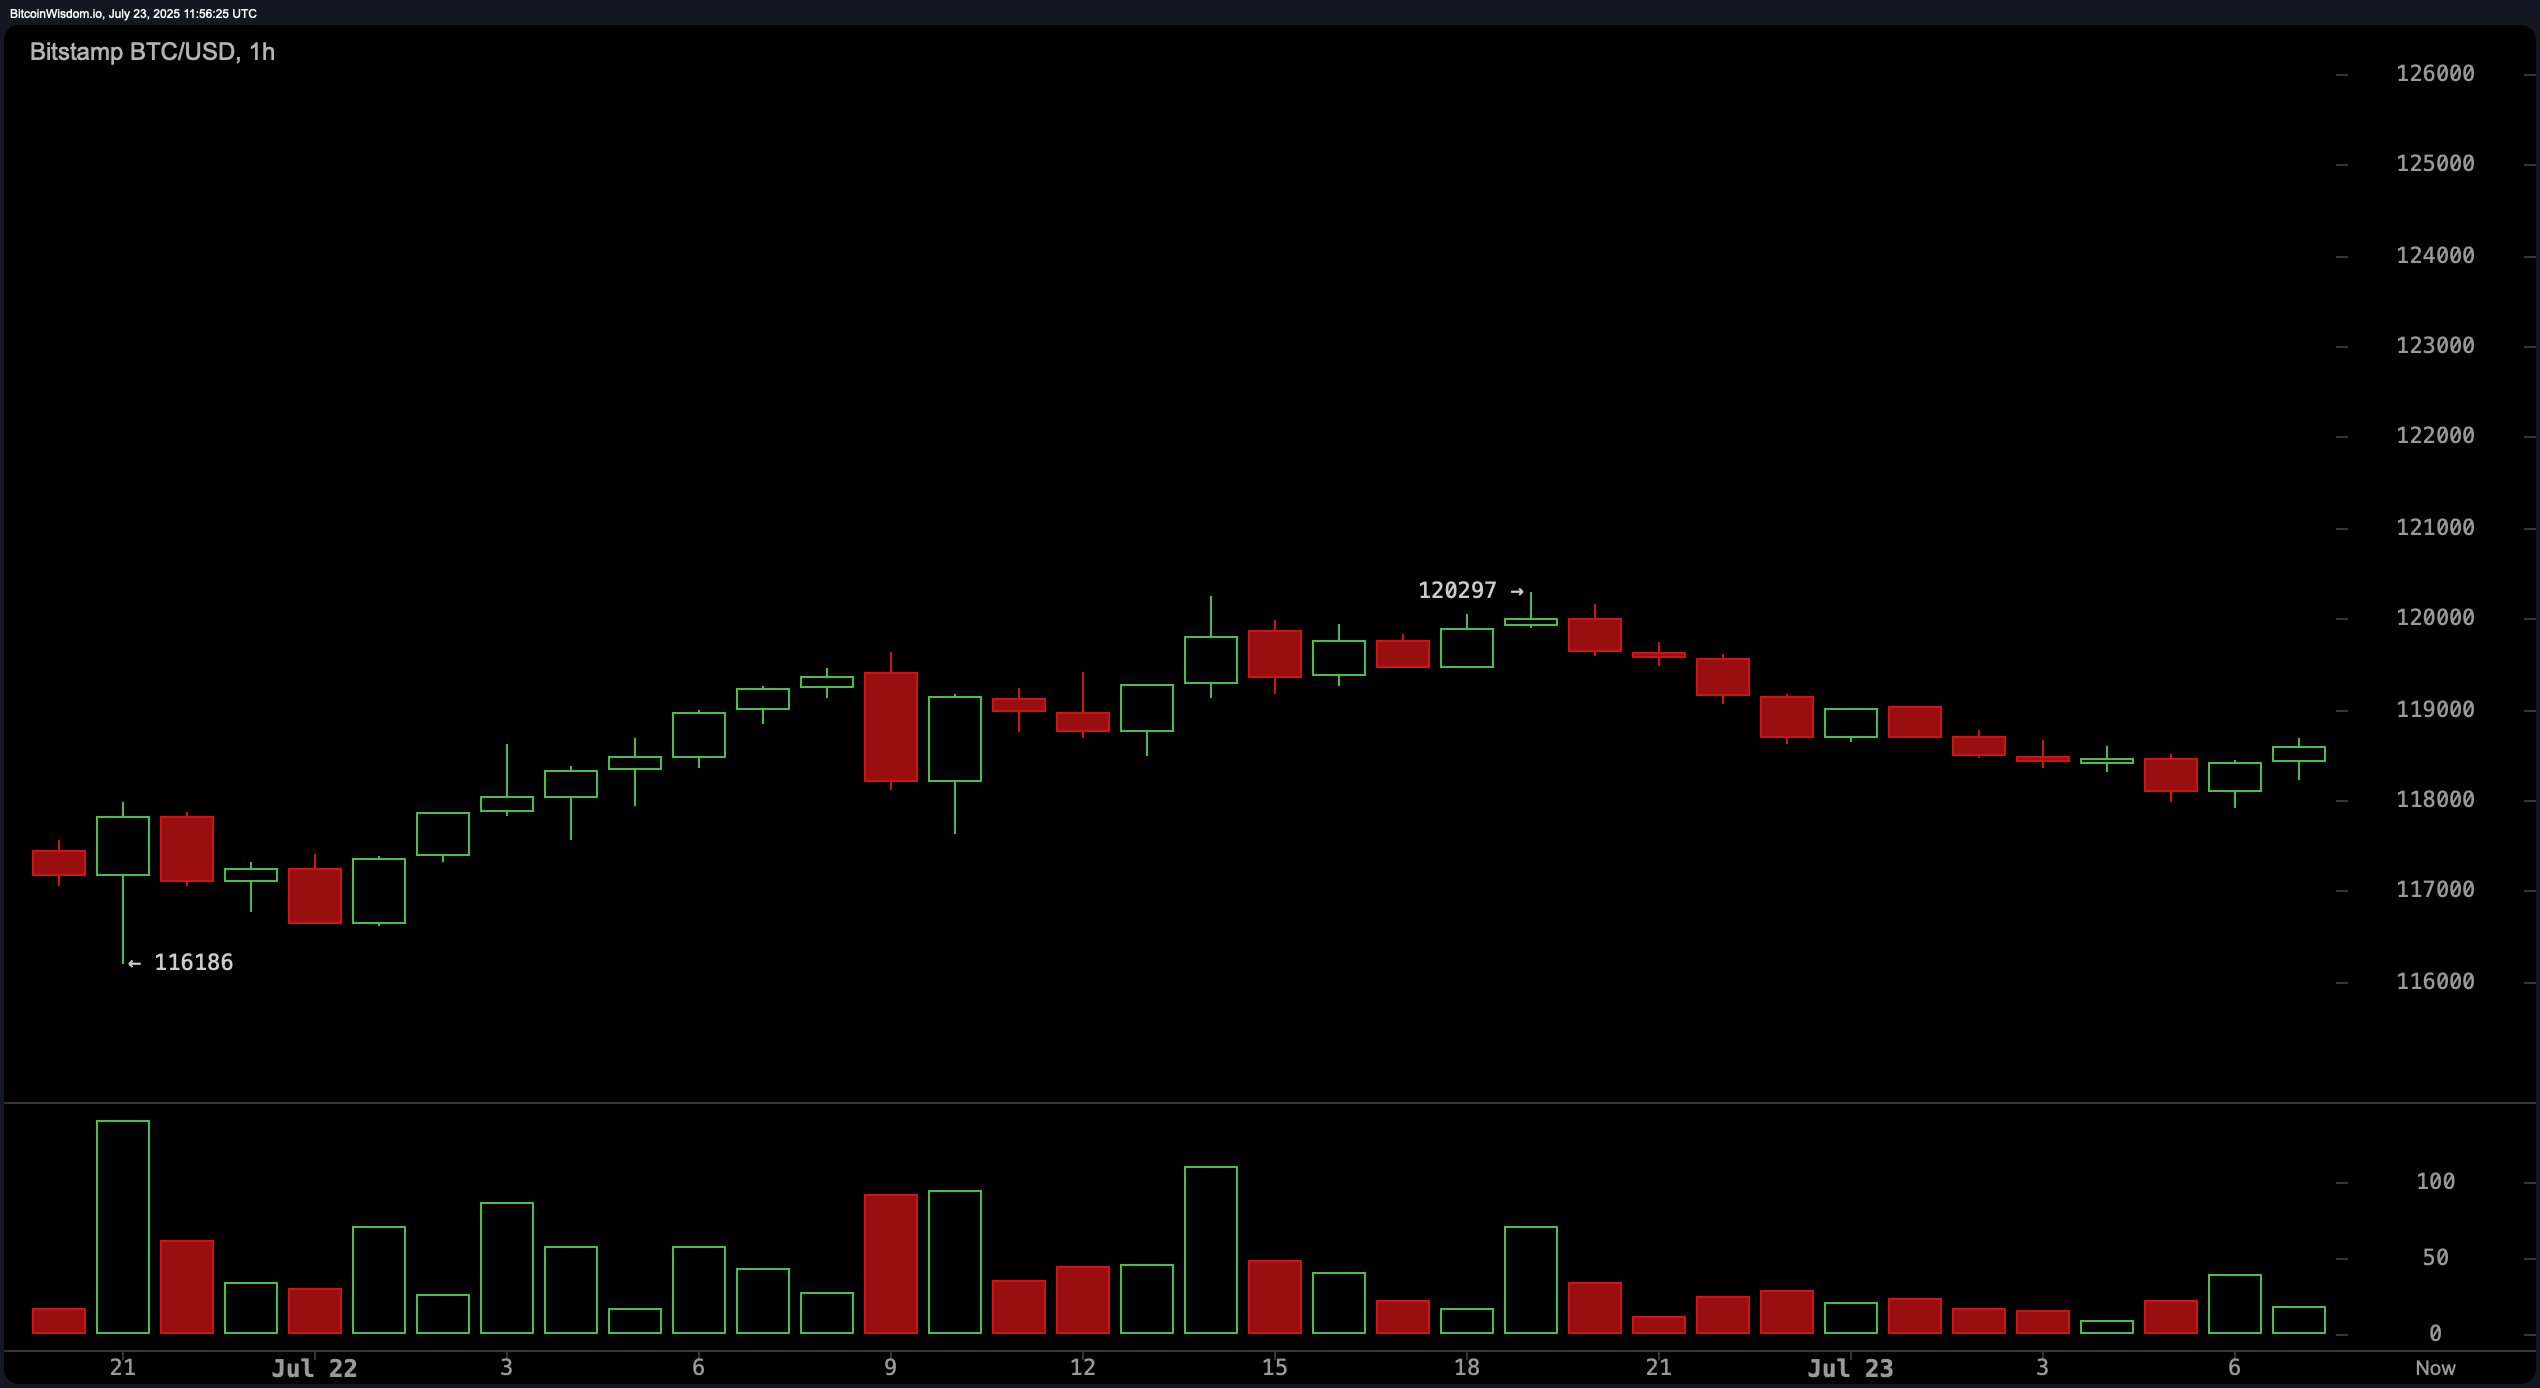
Now, let’s talk about the hourly chart. Oh boy. After a mighty surge to $120,297, Bitcoin’s recent performance can best be described as “meh.” It’s been stuck in a pattern of lower highs and lower lows, which doesn’t exactly scream “buy me!” The support level near $118,000 is holding up like a rock in a river, but if it crumbles, well, don’t be surprised. If you’re a day trader, you might find some joy in quick rebounds, but be sure to keep your stop losses tighter than your jeans after Thanksgiving dinner. 😬
Indicators are giving us mixed signals. Oscillators, in particular, seem to be as confused as a cat in a room full of laser pointers. RSI at 63, Stochastic at 68, CCI at 59 – it’s a cocktail of neutrality. But wait, there’s more! The momentum indicator is reading a rather grim -556, and the MACD is doing its best to frown with a level of 2,853. If this were a drama, this is the part where you’d say “Will they or won’t they?” 😅
However, the moving averages are a bit more optimistic, like that one friend who refuses to believe it’s over. The major EMAs and SMAs are all pointing to the sky, keeping their spirits high despite the occasional downturn. The short-term and long-term moving averages agree that Bitcoin’s uptrend is still in the cards. If the $117,000–$118,000 range holds up, Bitcoin could be off to the races again, possibly aiming for $122,000–$123,000. But don’t hold your breath. 💨
The Bullish Brigade
Here’s the good news: Bitcoin’s structure is solid. Those fancy moving averages are aligned to the upside, suggesting that the institutional crowd is still playing the game. If the support at $117,000–$118,000 holds and volume picks up, we could be looking at a bounce toward $122,000–$123,000. Bulls, grab your pom-poms! 📈
The Bearish Battalion
But hold your horses, because here comes the downside. The shorter timeframes aren’t looking too pretty. Bitcoin is showing signs of a weakening trend with bearish divergence, lower highs, and an overall lack of enthusiasm. The oscillators are giving us the stink eye, and a drop below $117,000 could lead to a deeper correction. It’s like the bear market is lurking in the shadows, just waiting for a chance to pounce. 🐻
Read More
- Brent Oil Forecast
- Gold Rate Forecast
- ATOM PREDICTION. ATOM cryptocurrency
- Silver Rate Forecast
- XRPL Just Got a Brain Transplant: Smart Escrows Are Here to Save Your Crypto Drama
- How the SEC and Nasdaq Play Whack-a-Mole with Chinese IPO Scandals 🎭💼
- EUR AUD PREDICTION
- OpenSea’s CTO Dishes on the Future Beyond NFTs: A Dash of DeFi and a Pinch of AI 🌟
- Australia’s New Crypto ATM Powers: Will They Ban or Just Be Dramatic? 🤔
- Unraveling the Enigma: Chainlink and SBI’s Financial Tango! 💃🕺
2025-07-23 15:57