So, Ethereum’s hanging out at a fancy $3,674 today, because apparently, it has a flair for drama and volatility. Capitalization? A cool $443 billion. Volume? $41.24 billion—more than my Netflix bill. Price swings? Between $3,650 and $3,758.05. Sounds like a dance floor at 2 a.m., right? All this while Ethereum pretends to be consolidating—probably just catching its breath before another run for the hills, or maybe a nap. Stay tuned! 🎢
Ethereum
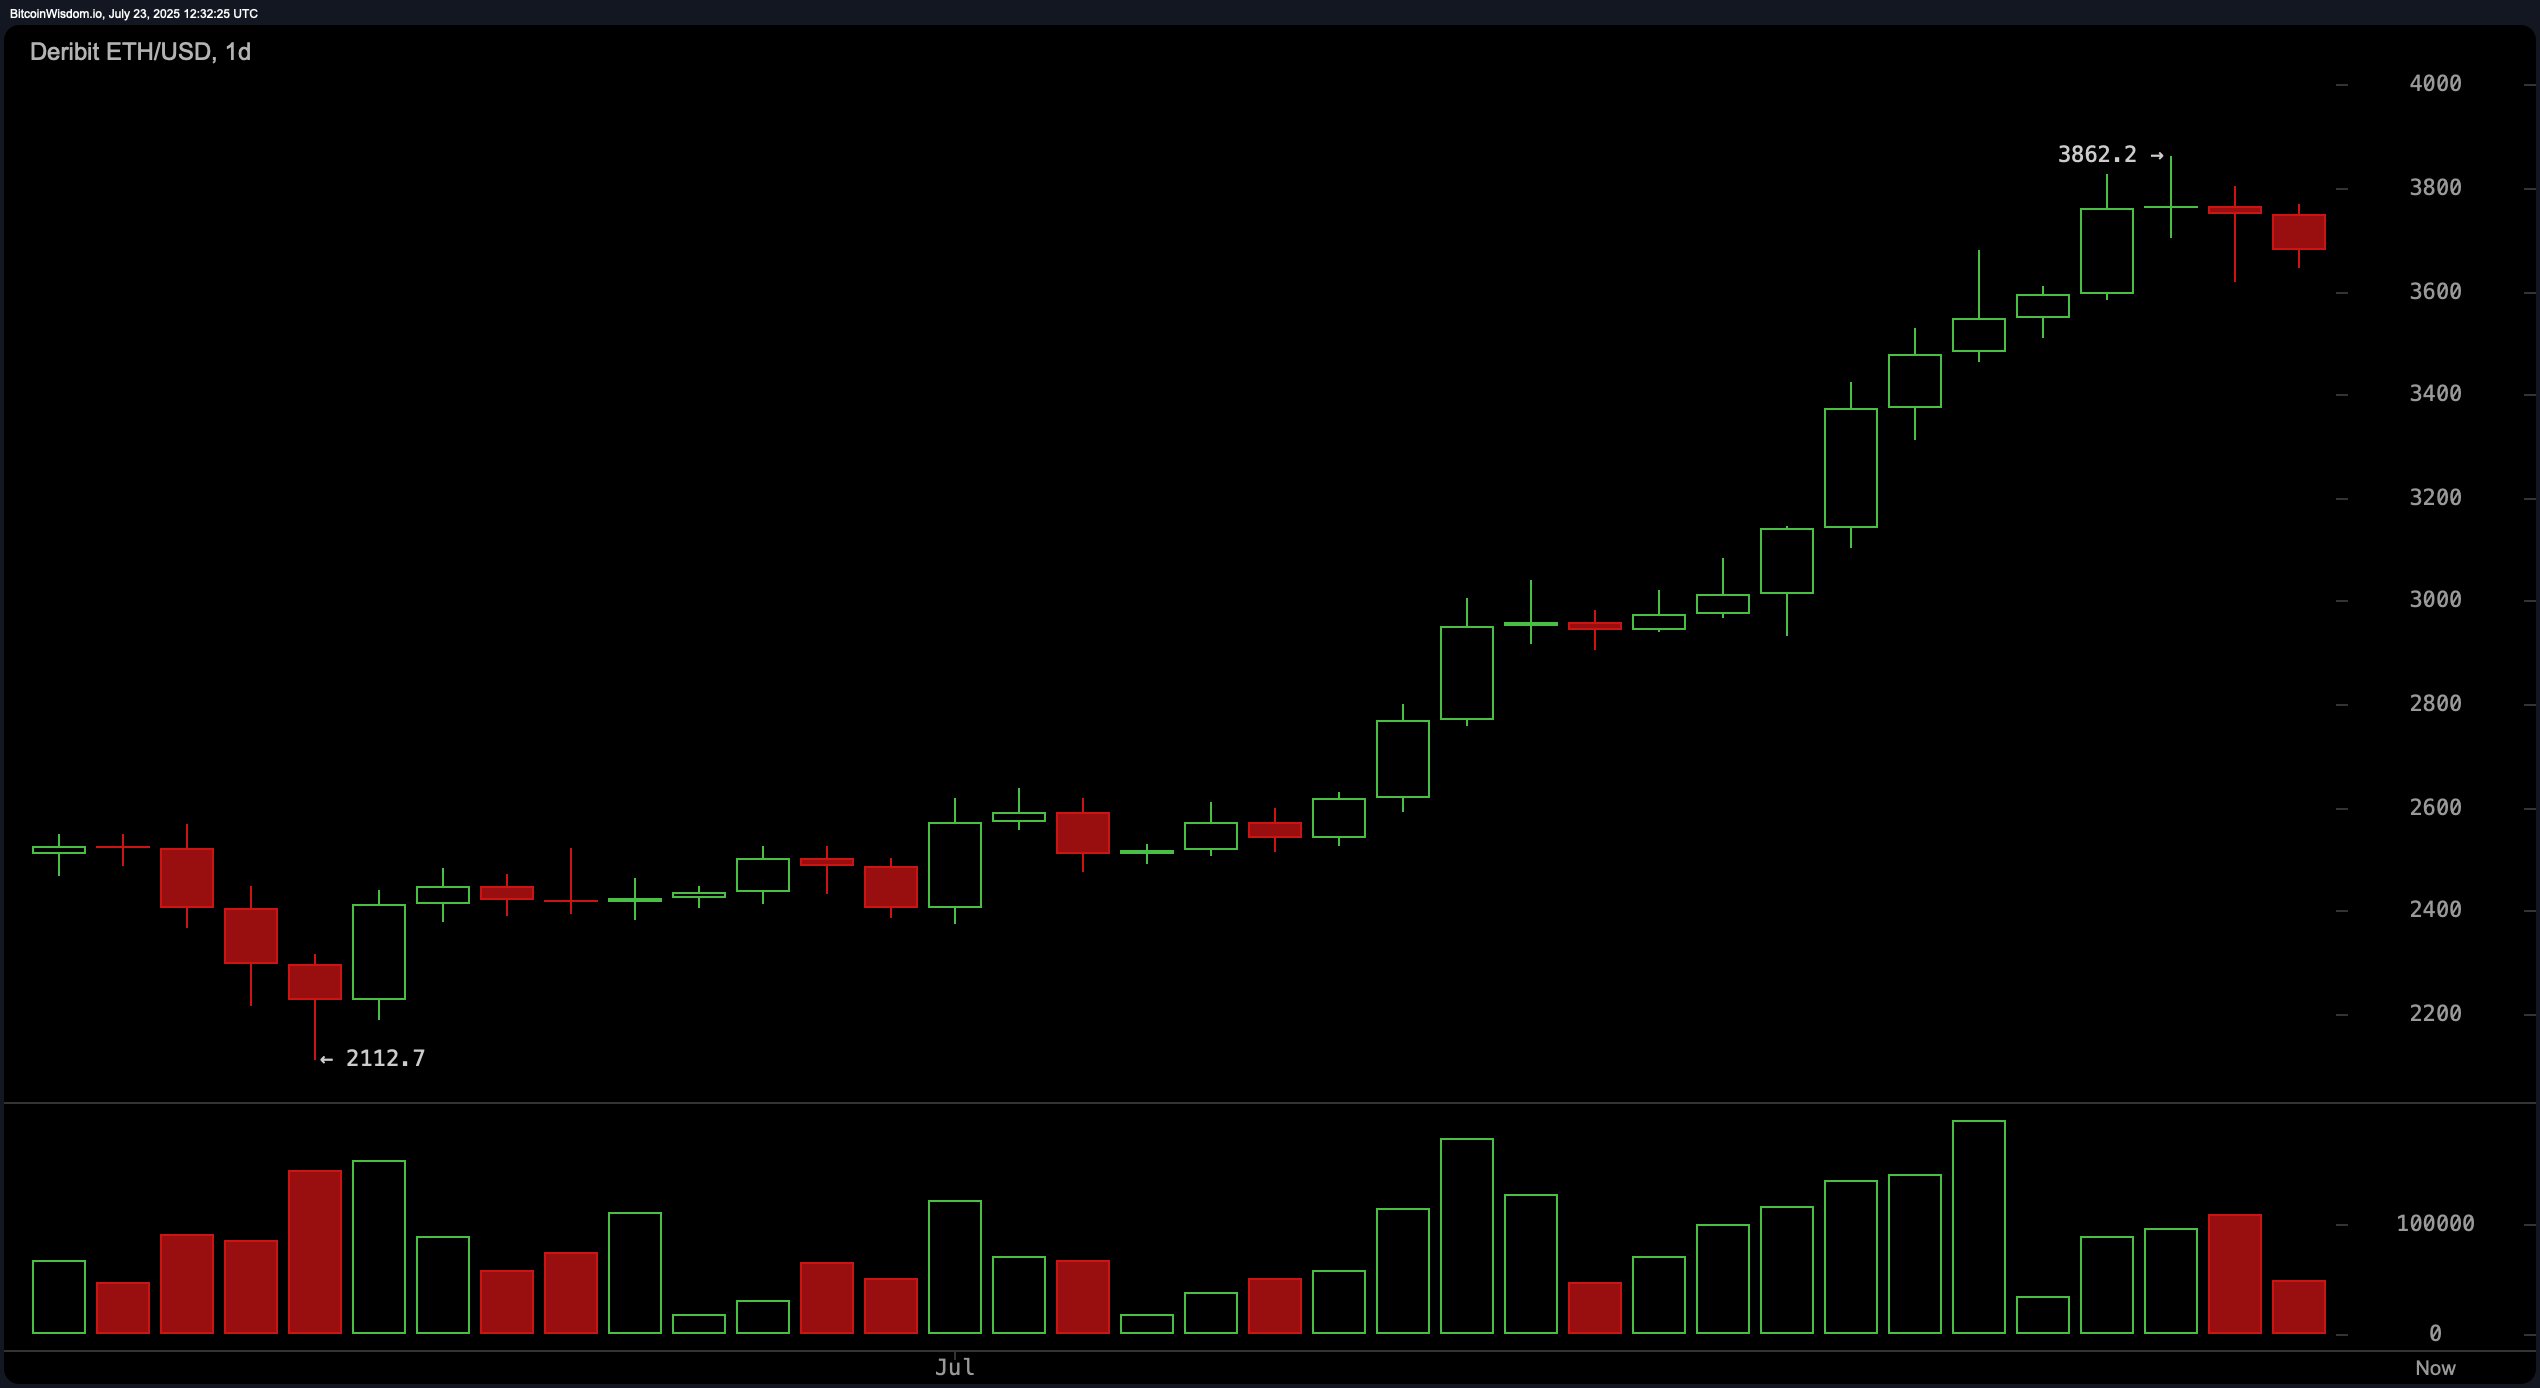
From the long-view lens, Ethereum’s like that one friend who always says “I’m in a long-term relationship with the bull market”—rallying from about $2,112 to a peak of $3,862. But cats always land on their feet, and recent candle action looks a tad bearish, with volume dwindling faster than my motivation on a Monday. Support is forming around $3,600—think of it as Ethereum’s safety net—while resistance is stubbornly hanging in the $3,800 to $3,860 zone like a grumpy cat refusing to move. 🐱
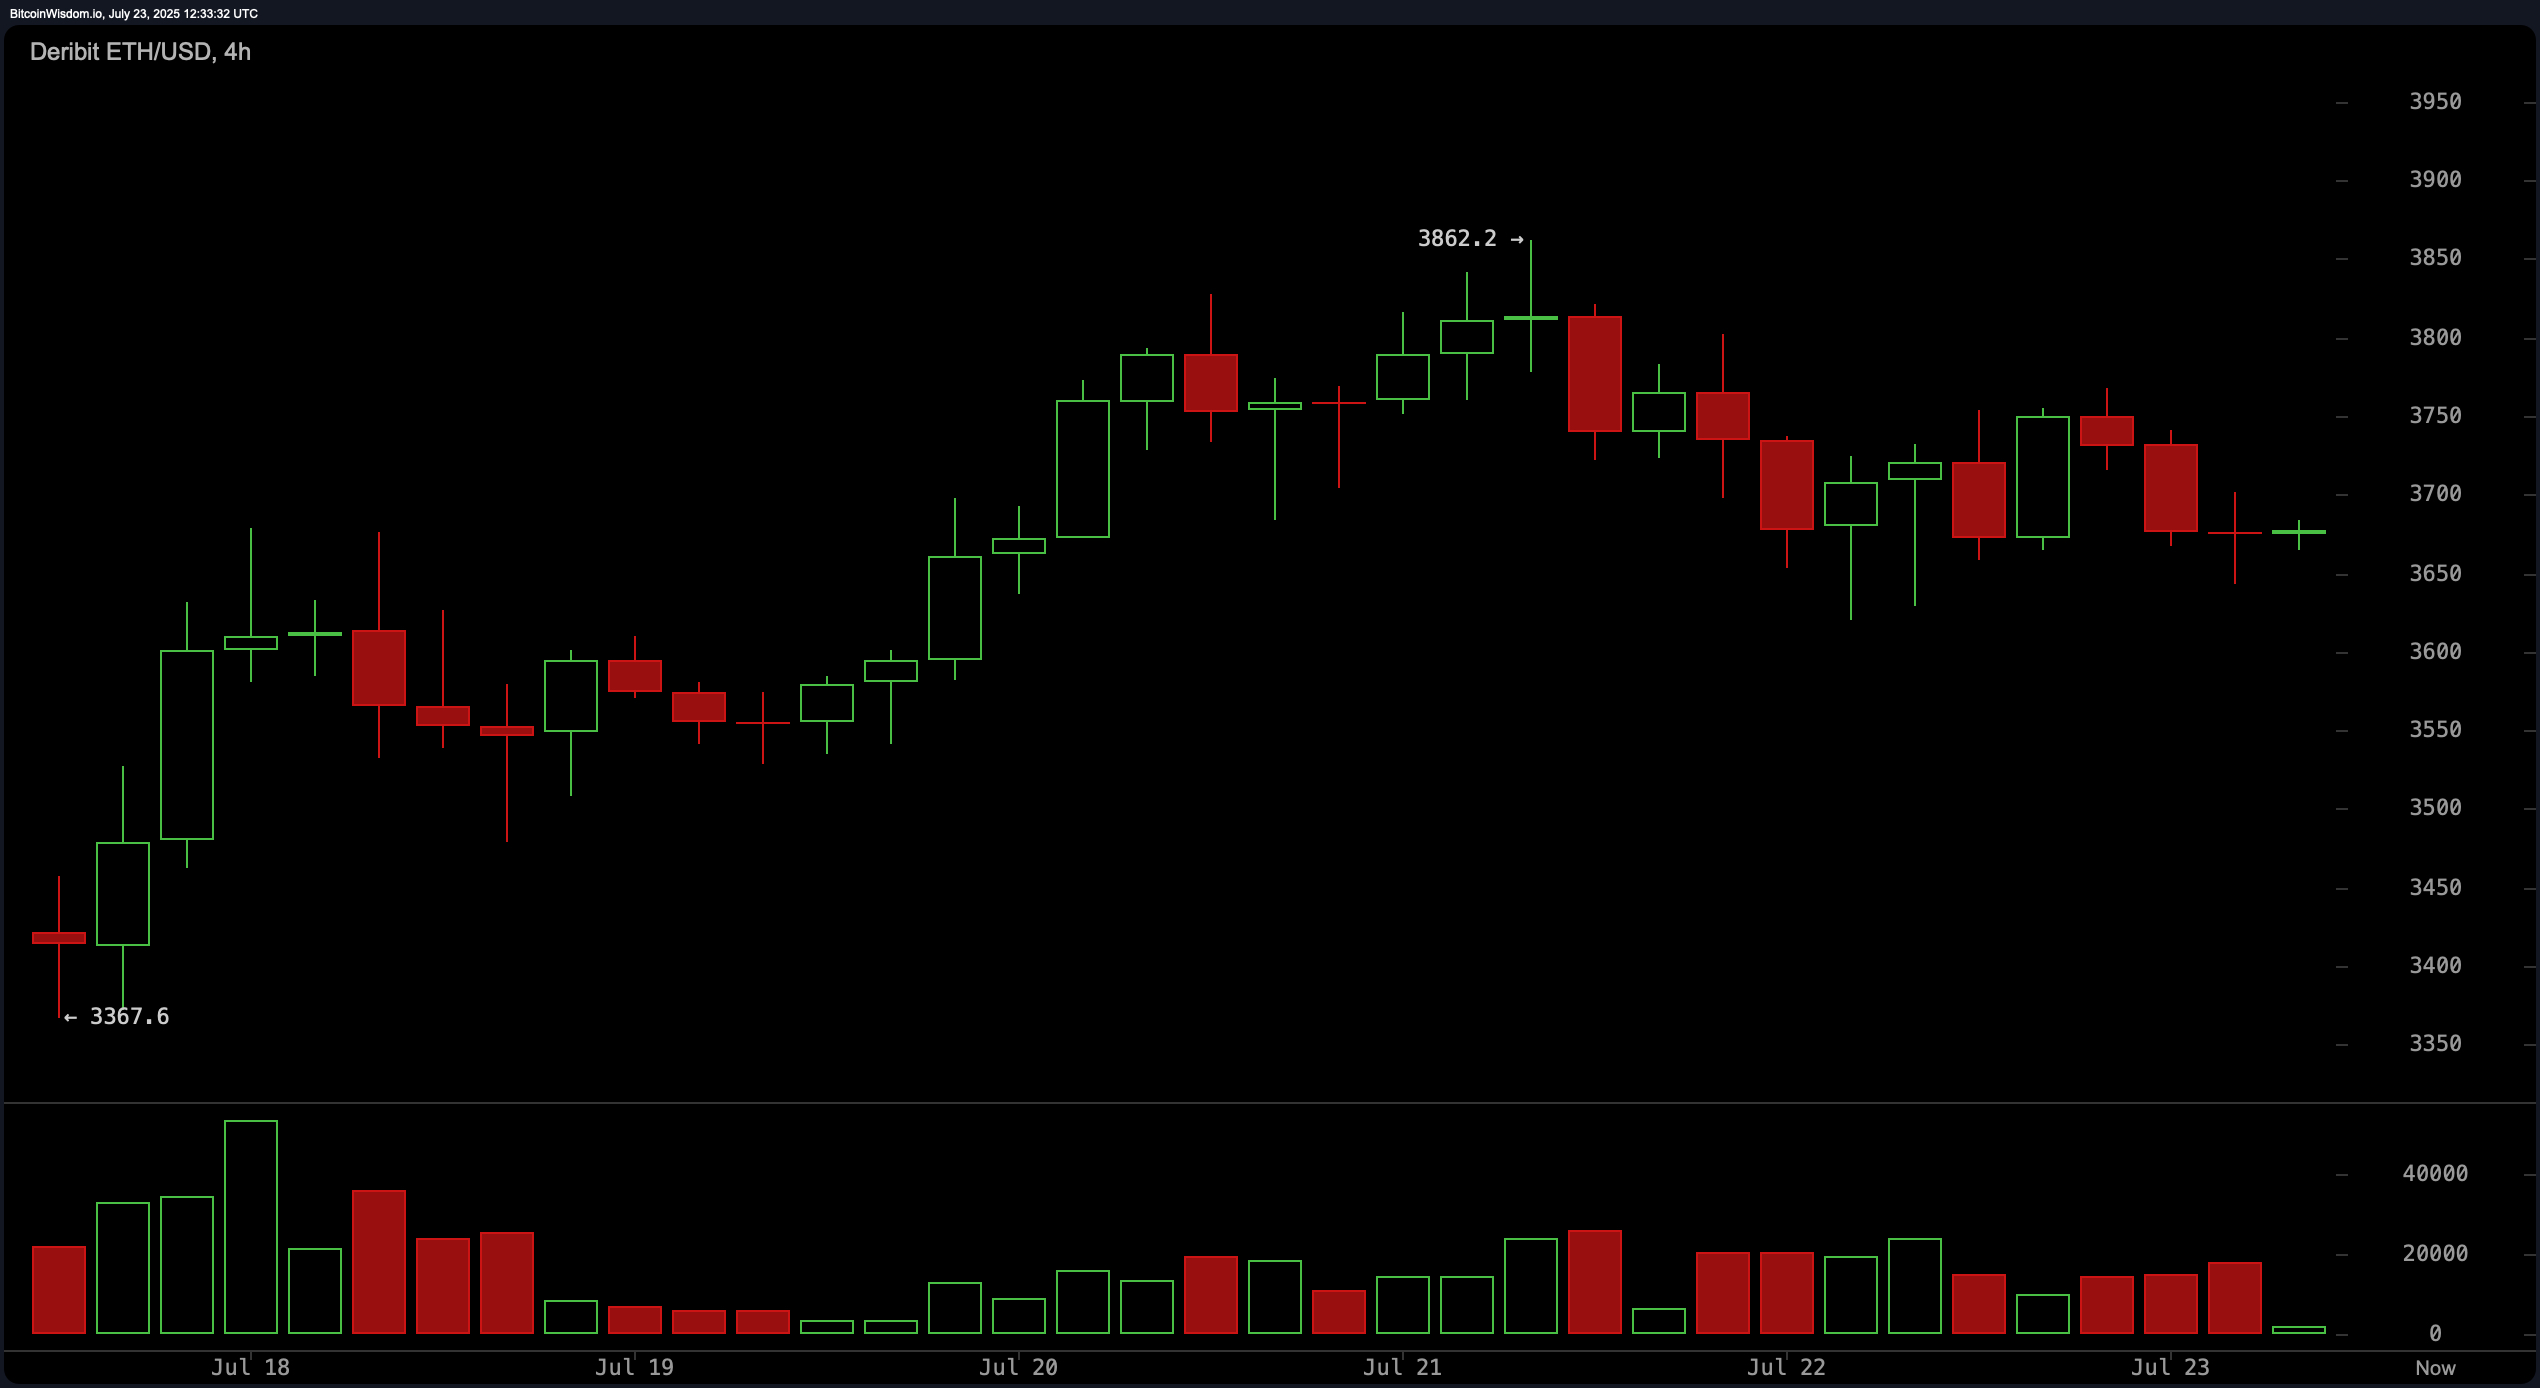
The 4-hour chart? Think of it as Ethereum’s mid-life crisis. It’s kind of retreating from its high of $3,862, not exactly setting the world on fire but just chilling between $3,650 and $3,750. Lower highs and dropping volume scream, “Hey, I’m a little cautious today,” so short-term bears are feeling pretty confident. If Ethereum can’t rally above $3,750 soon, it might just decide to go lower—say, down to $3,640 or worse. But if it pulls a rabbit out of its hat and breaks above $3,750 with gusto? We might see a comeback! 🐇
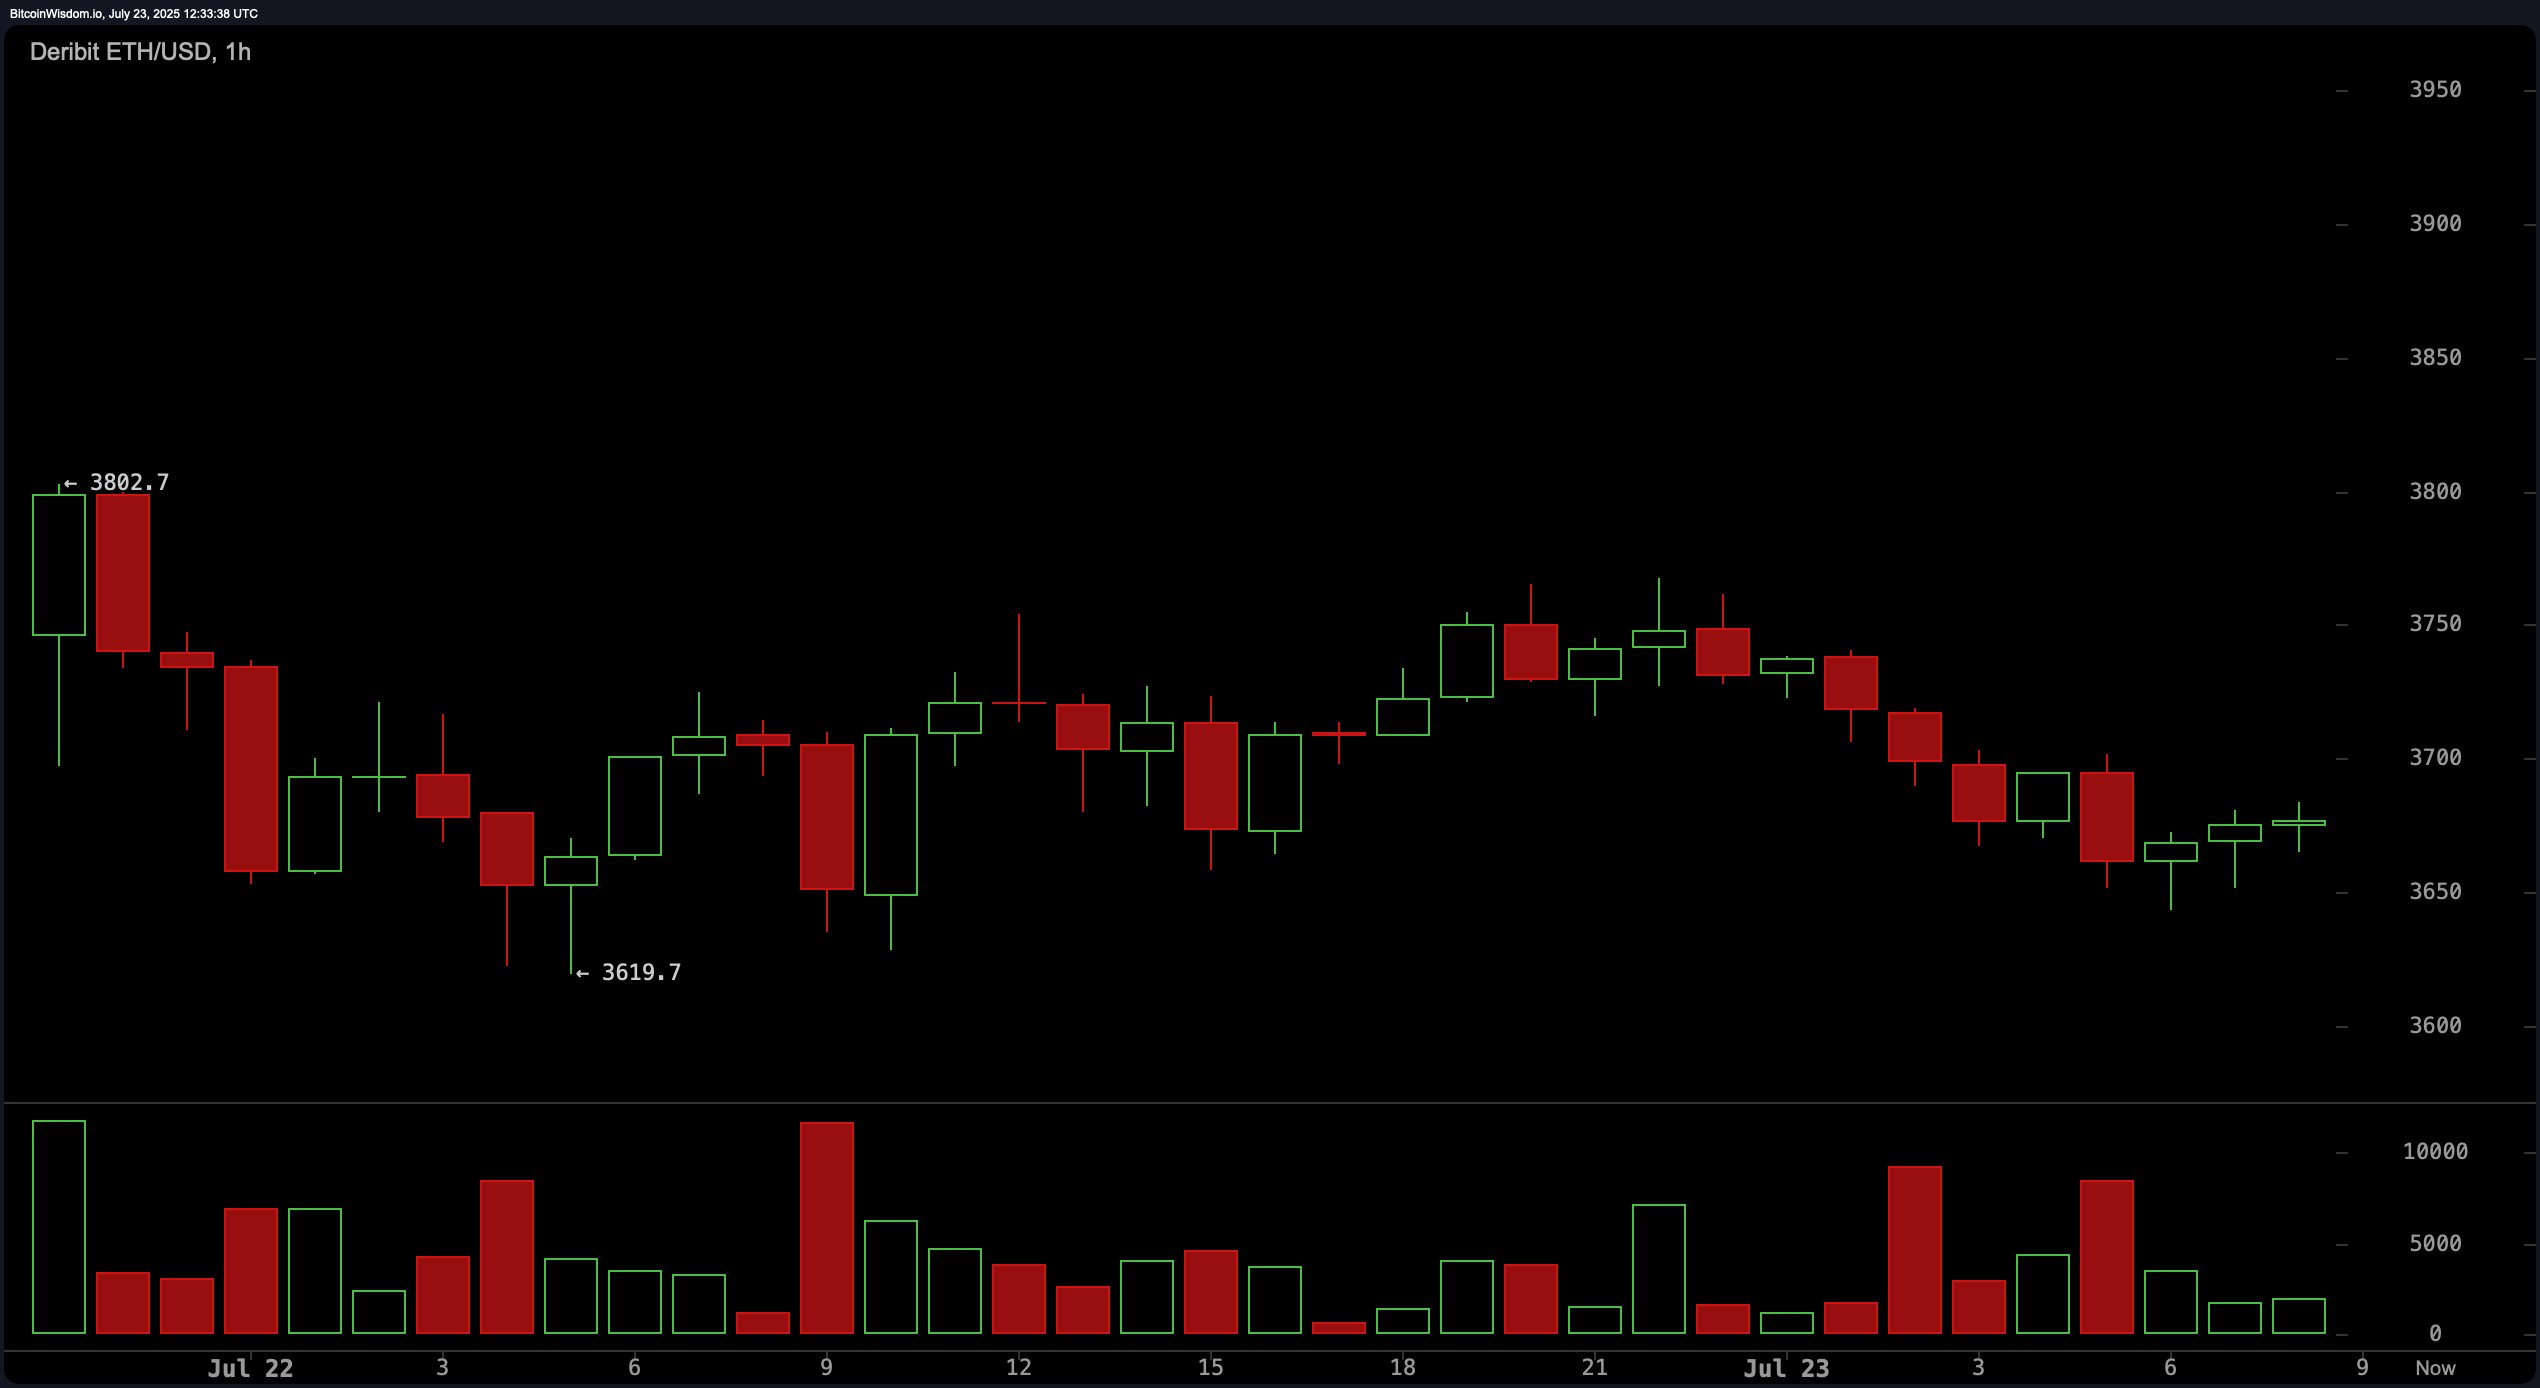
Zooming into the 1-hour chart, Ethereum is basically doing the sideways shuffle—like that awkward dance move you do when you’re not quite sure if you’re supposed to dance or leave the party. A sharp dip from $3,802 kicked off some indecisiveness, with market support around $3,670–$3,680. The candles are tiny and trading volume is quiet—like the library after hours. Resistance? Around $3,730–$3,750, where the sellers are probably lurking, ready to pounce like cats in the shadows.
Oscillators? They’re basically the weather forecast for Ethereum’s mood: RSI at 80 and Stochastic at 89.2 — overbought, so maybe cooling off soon. The momentum indicator? Slightly bearish at 703.3. MACD is like that one friend who’s upbeat but also hints, “Hey, uh, maybe slow down.” Meanwhile, other indicators like CCI and ADX? They’re just kind of hanging out, implying trend, but not giving a clear yes or no. The Awesome oscillator? Totally neutral—like a Switzerland of indicators.
But wait, the long-term outlook? Still pretty bullish! Moving averages from 10 to 200? All glowing with positivity, like Ethereum just got a new haircut. The 10-day EMA at about $3,507 or so, and the 200-day SMA chilling at $2,480—these are Ethereum’s way of saying, “I got this.” Unless someone breaks below $3,600 with volume, Ethereum looks like it’s just taking a breather, probably gearing up for another run.
The Bull-ish Side:
Bitcoin’s…uh, I mean, Ethereum’s trend is pretty bullish. As long as $3,600 holds, and MACD plus moving averages stay supportive, Ethereum’s eyeing a jump to $3,800–$3,860, maybe even a new high if it’s feeling lucky. Keep those sideways looks handy; this crypto game loves making us sweat!
The Nitty-Gritty Bear Side:
Hourglasses are running out—these overbought signals from RSI and Stochastic suggest Ethereum might be headed for a nap or maybe a nosedive. If it breaks down below $3,600 with heavy volume, don’t be surprised if it visits $3,400 or even $3,300 just to keep things exciting. Bears ready; gloves on!
Read More
- Brent Oil Forecast
- Gold Rate Forecast
- ATOM PREDICTION. ATOM cryptocurrency
- Silver Rate Forecast
- Australia’s New Crypto ATM Powers: Will They Ban or Just Be Dramatic? 🤔
- XRPL Just Got a Brain Transplant: Smart Escrows Are Here to Save Your Crypto Drama
- Unraveling the Enigma: Chainlink and SBI’s Financial Tango! 💃🕺
- How the SEC and Nasdaq Play Whack-a-Mole with Chinese IPO Scandals 🎭💼
- EUR AUD PREDICTION
- OpenSea’s CTO Dishes on the Future Beyond NFTs: A Dash of DeFi and a Pinch of AI 🌟
2025-07-23 16:32