Well, here we are again, folks-Bitcoin, the digital darling of the financial world, is behaving like a teenager trying to decide whether to commit to a trend or just lounge around in its pajamas. On Wednesday, it traded within a range so defined you’d think it was fenced in by a particularly stubborn sheepdog. Price action? Hovering near the upper half of its intraday band, like someone who’s almost ready to leave the party but can’t quite find their coat.
Bitcoin Chart Outlook on March 25
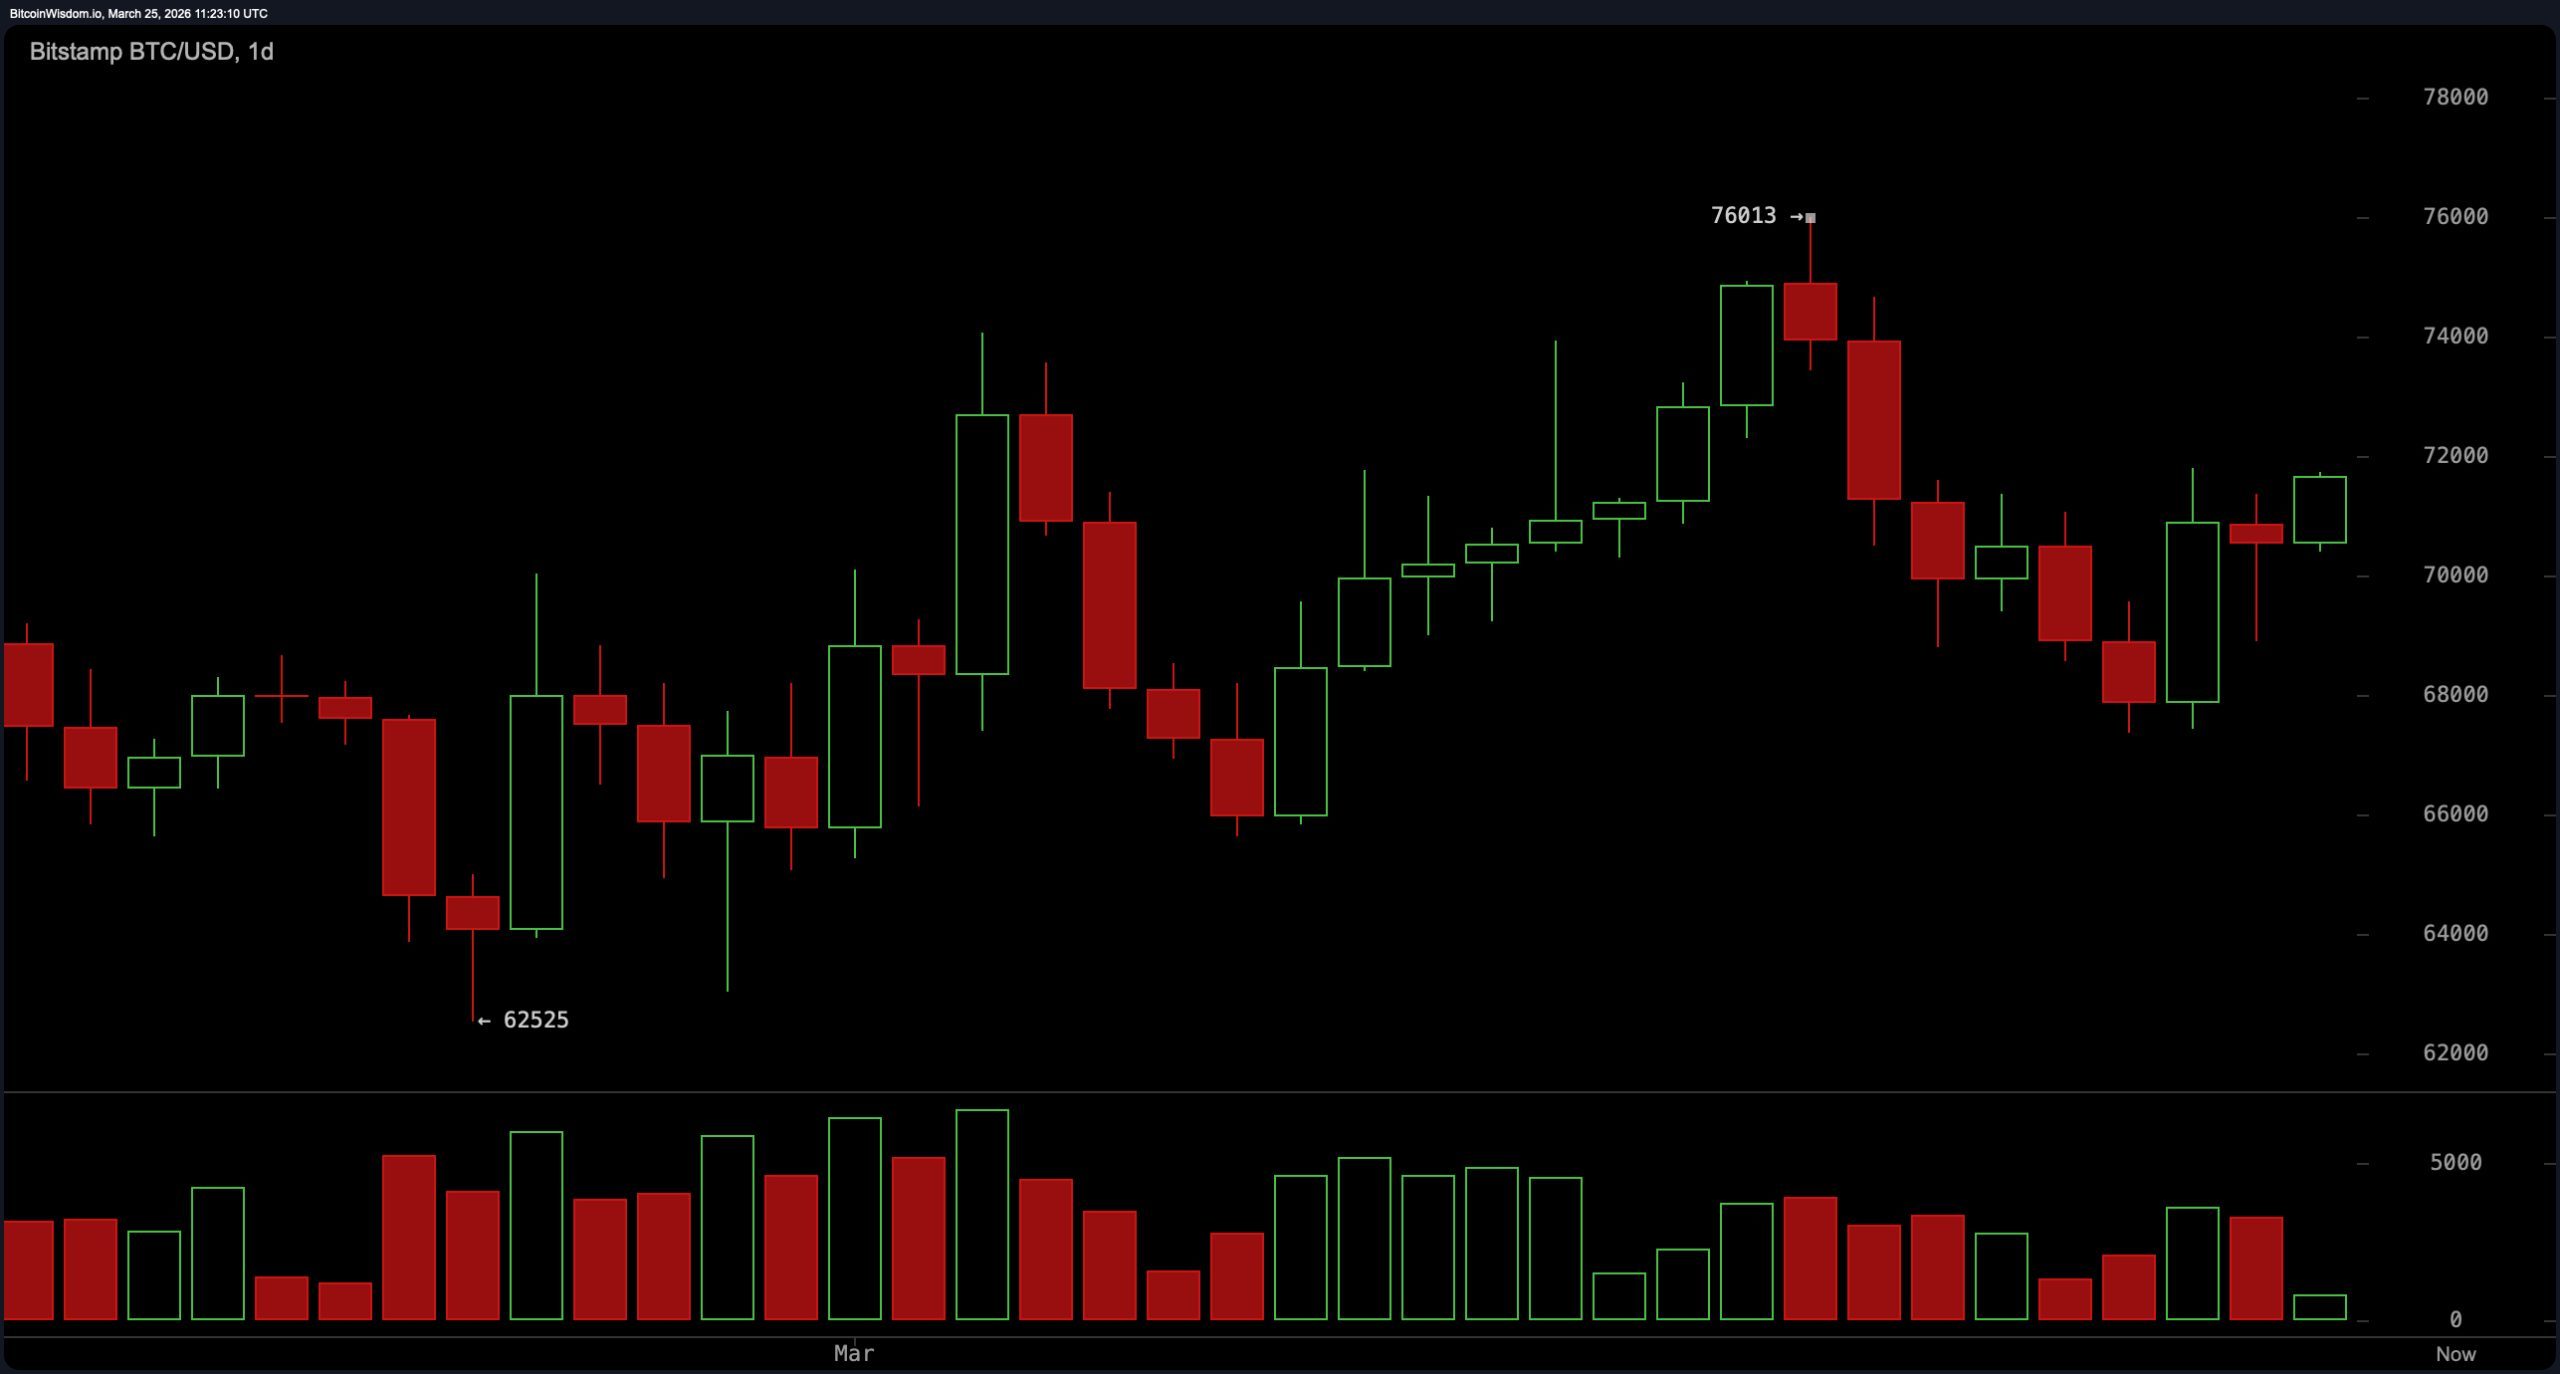
The daily chart for Bitcoin looks like a person who’s lost their keys-directionless but not entirely hopeless. It held within a 24-hour range of $68,969 to $72,026, which is about as exciting as watching paint dry, but at least it’s above the psychological support of $70,000. Because, you know, $70,000 is the new $10,000, or something.
No decisive breakout or breakdown? Check. Consolidation rather than reversal? Double-check. Historical volume concentration below $70,000 suggests there’s still demand, like a buffet line that’s always got a few stragglers. So, no need to panic-yet.
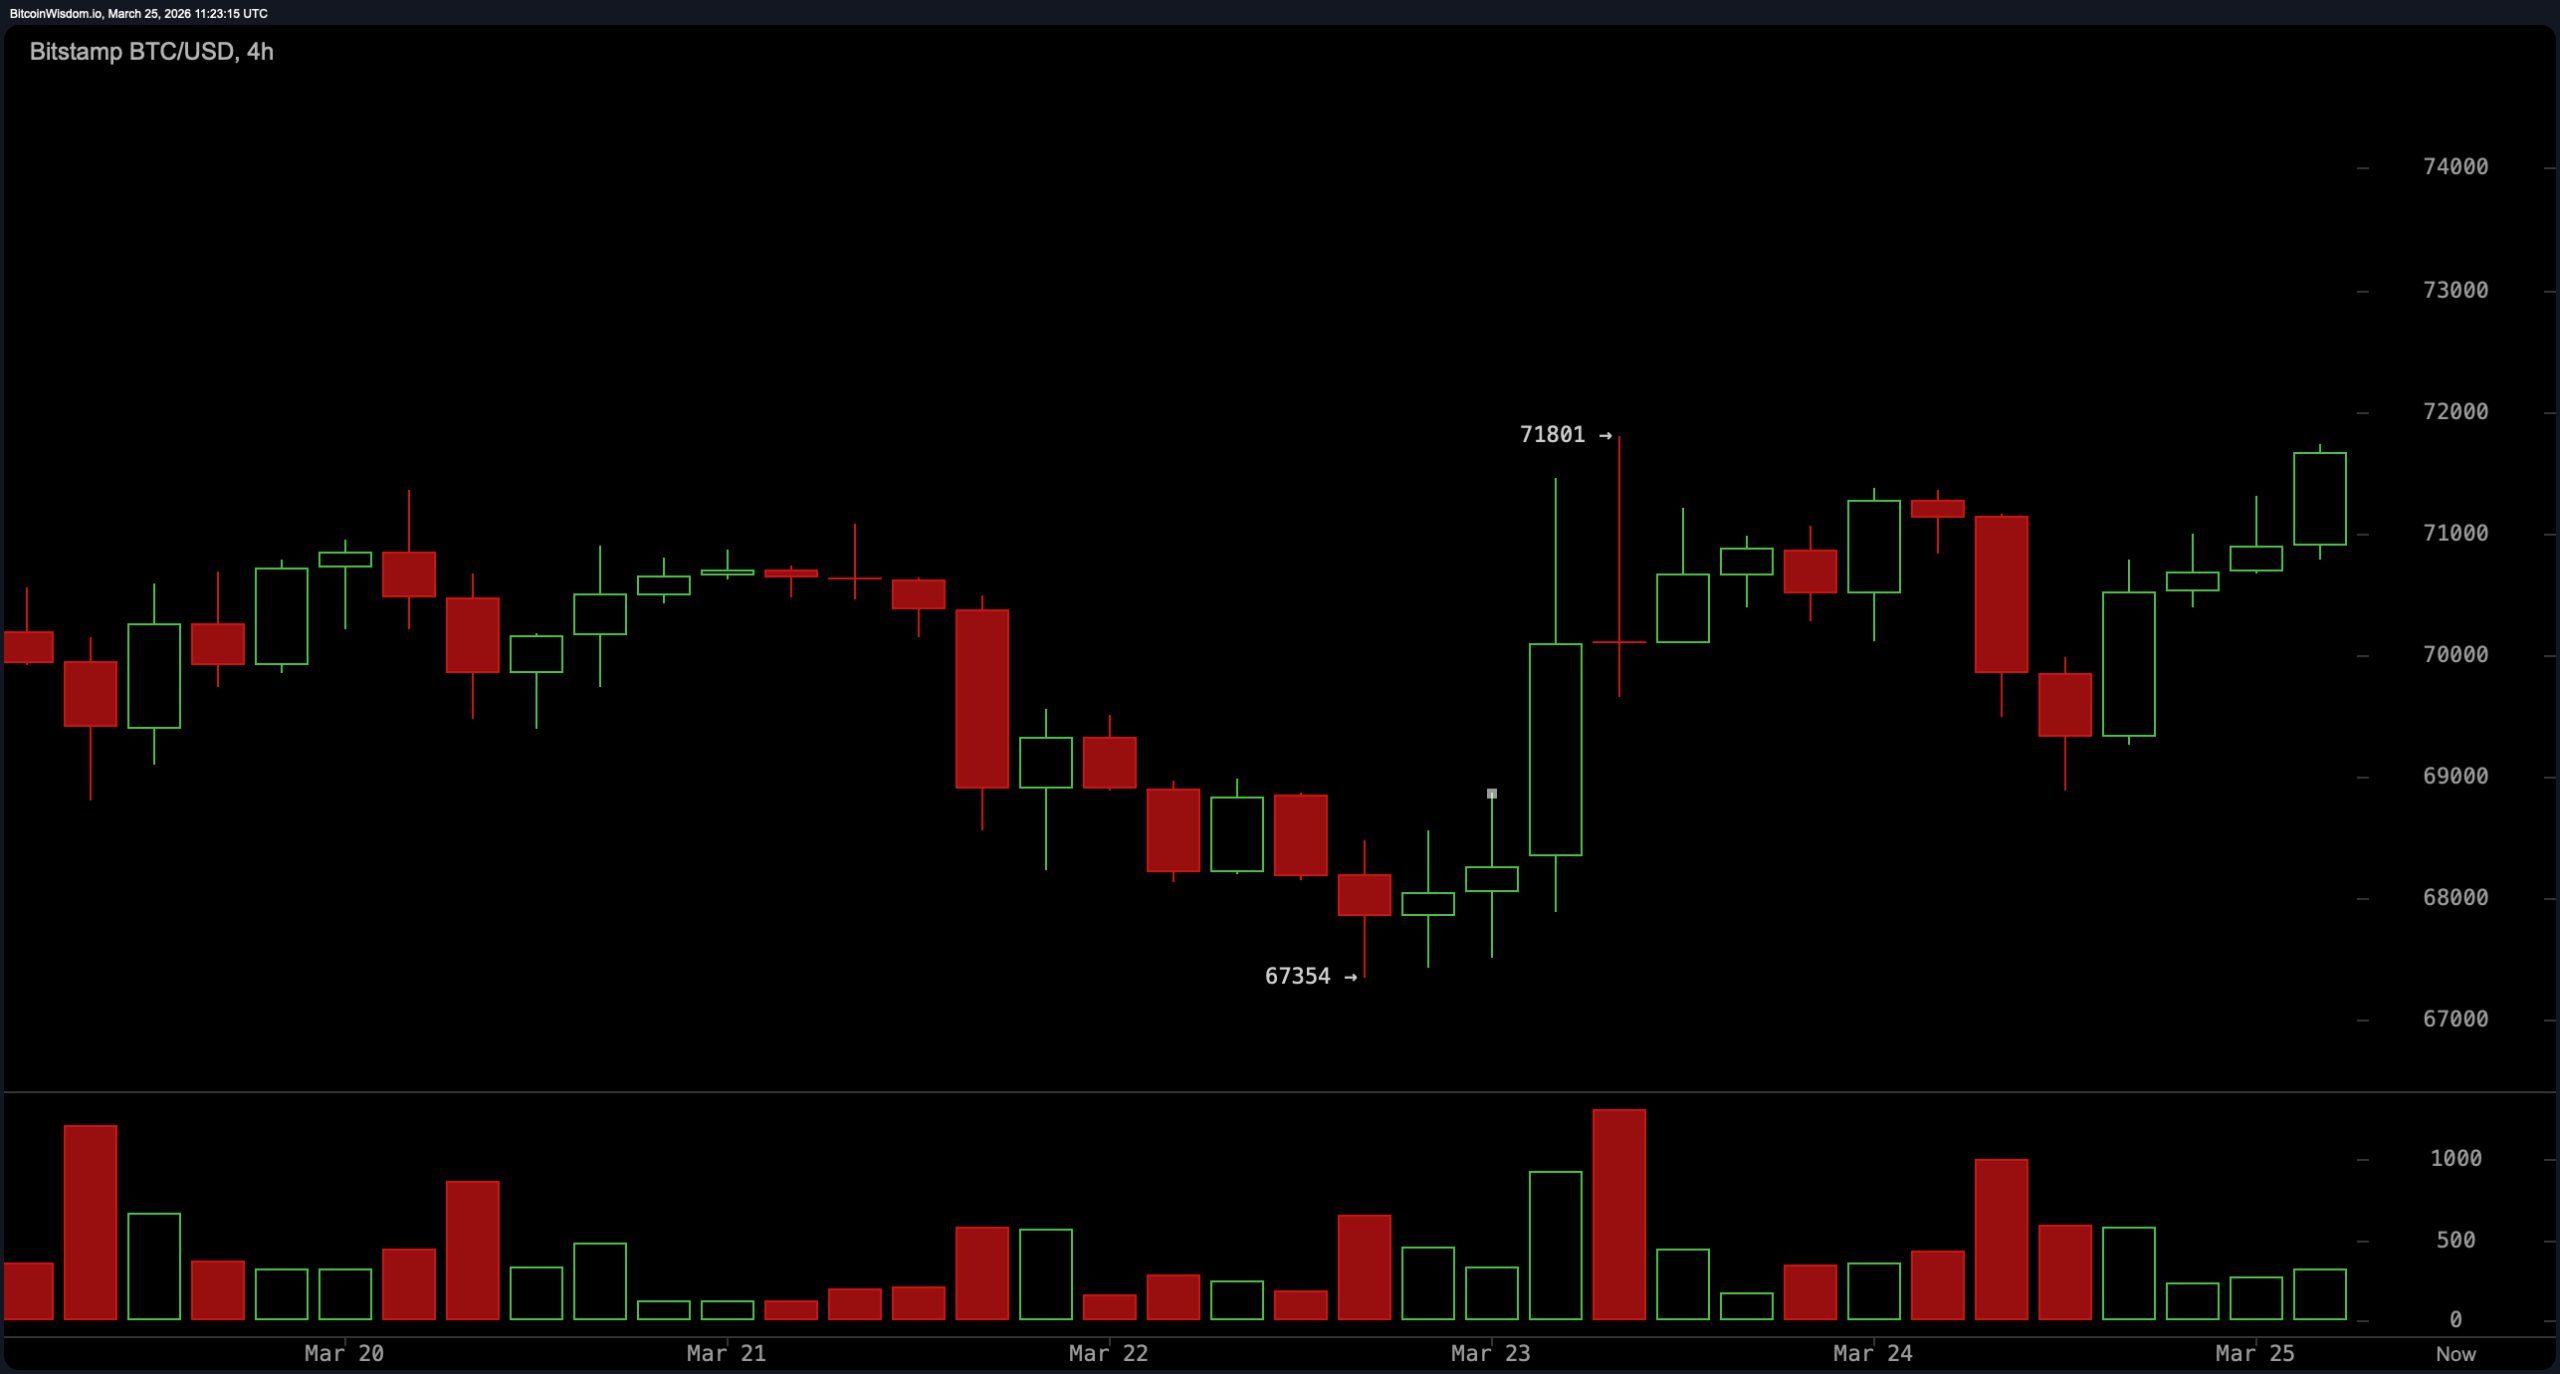
On the four-hour chart, Bitcoin is constructive but not exactly sprinting. It’s like that friend who says they’re coming over but takes three hours to get there. Higher lows? Sure. Momentum beyond $71,600? Not so much. Resistance remains as stubborn as a toddler at bedtime. The market’s pausing, not preparing for a grand entrance-sorry to disappoint.
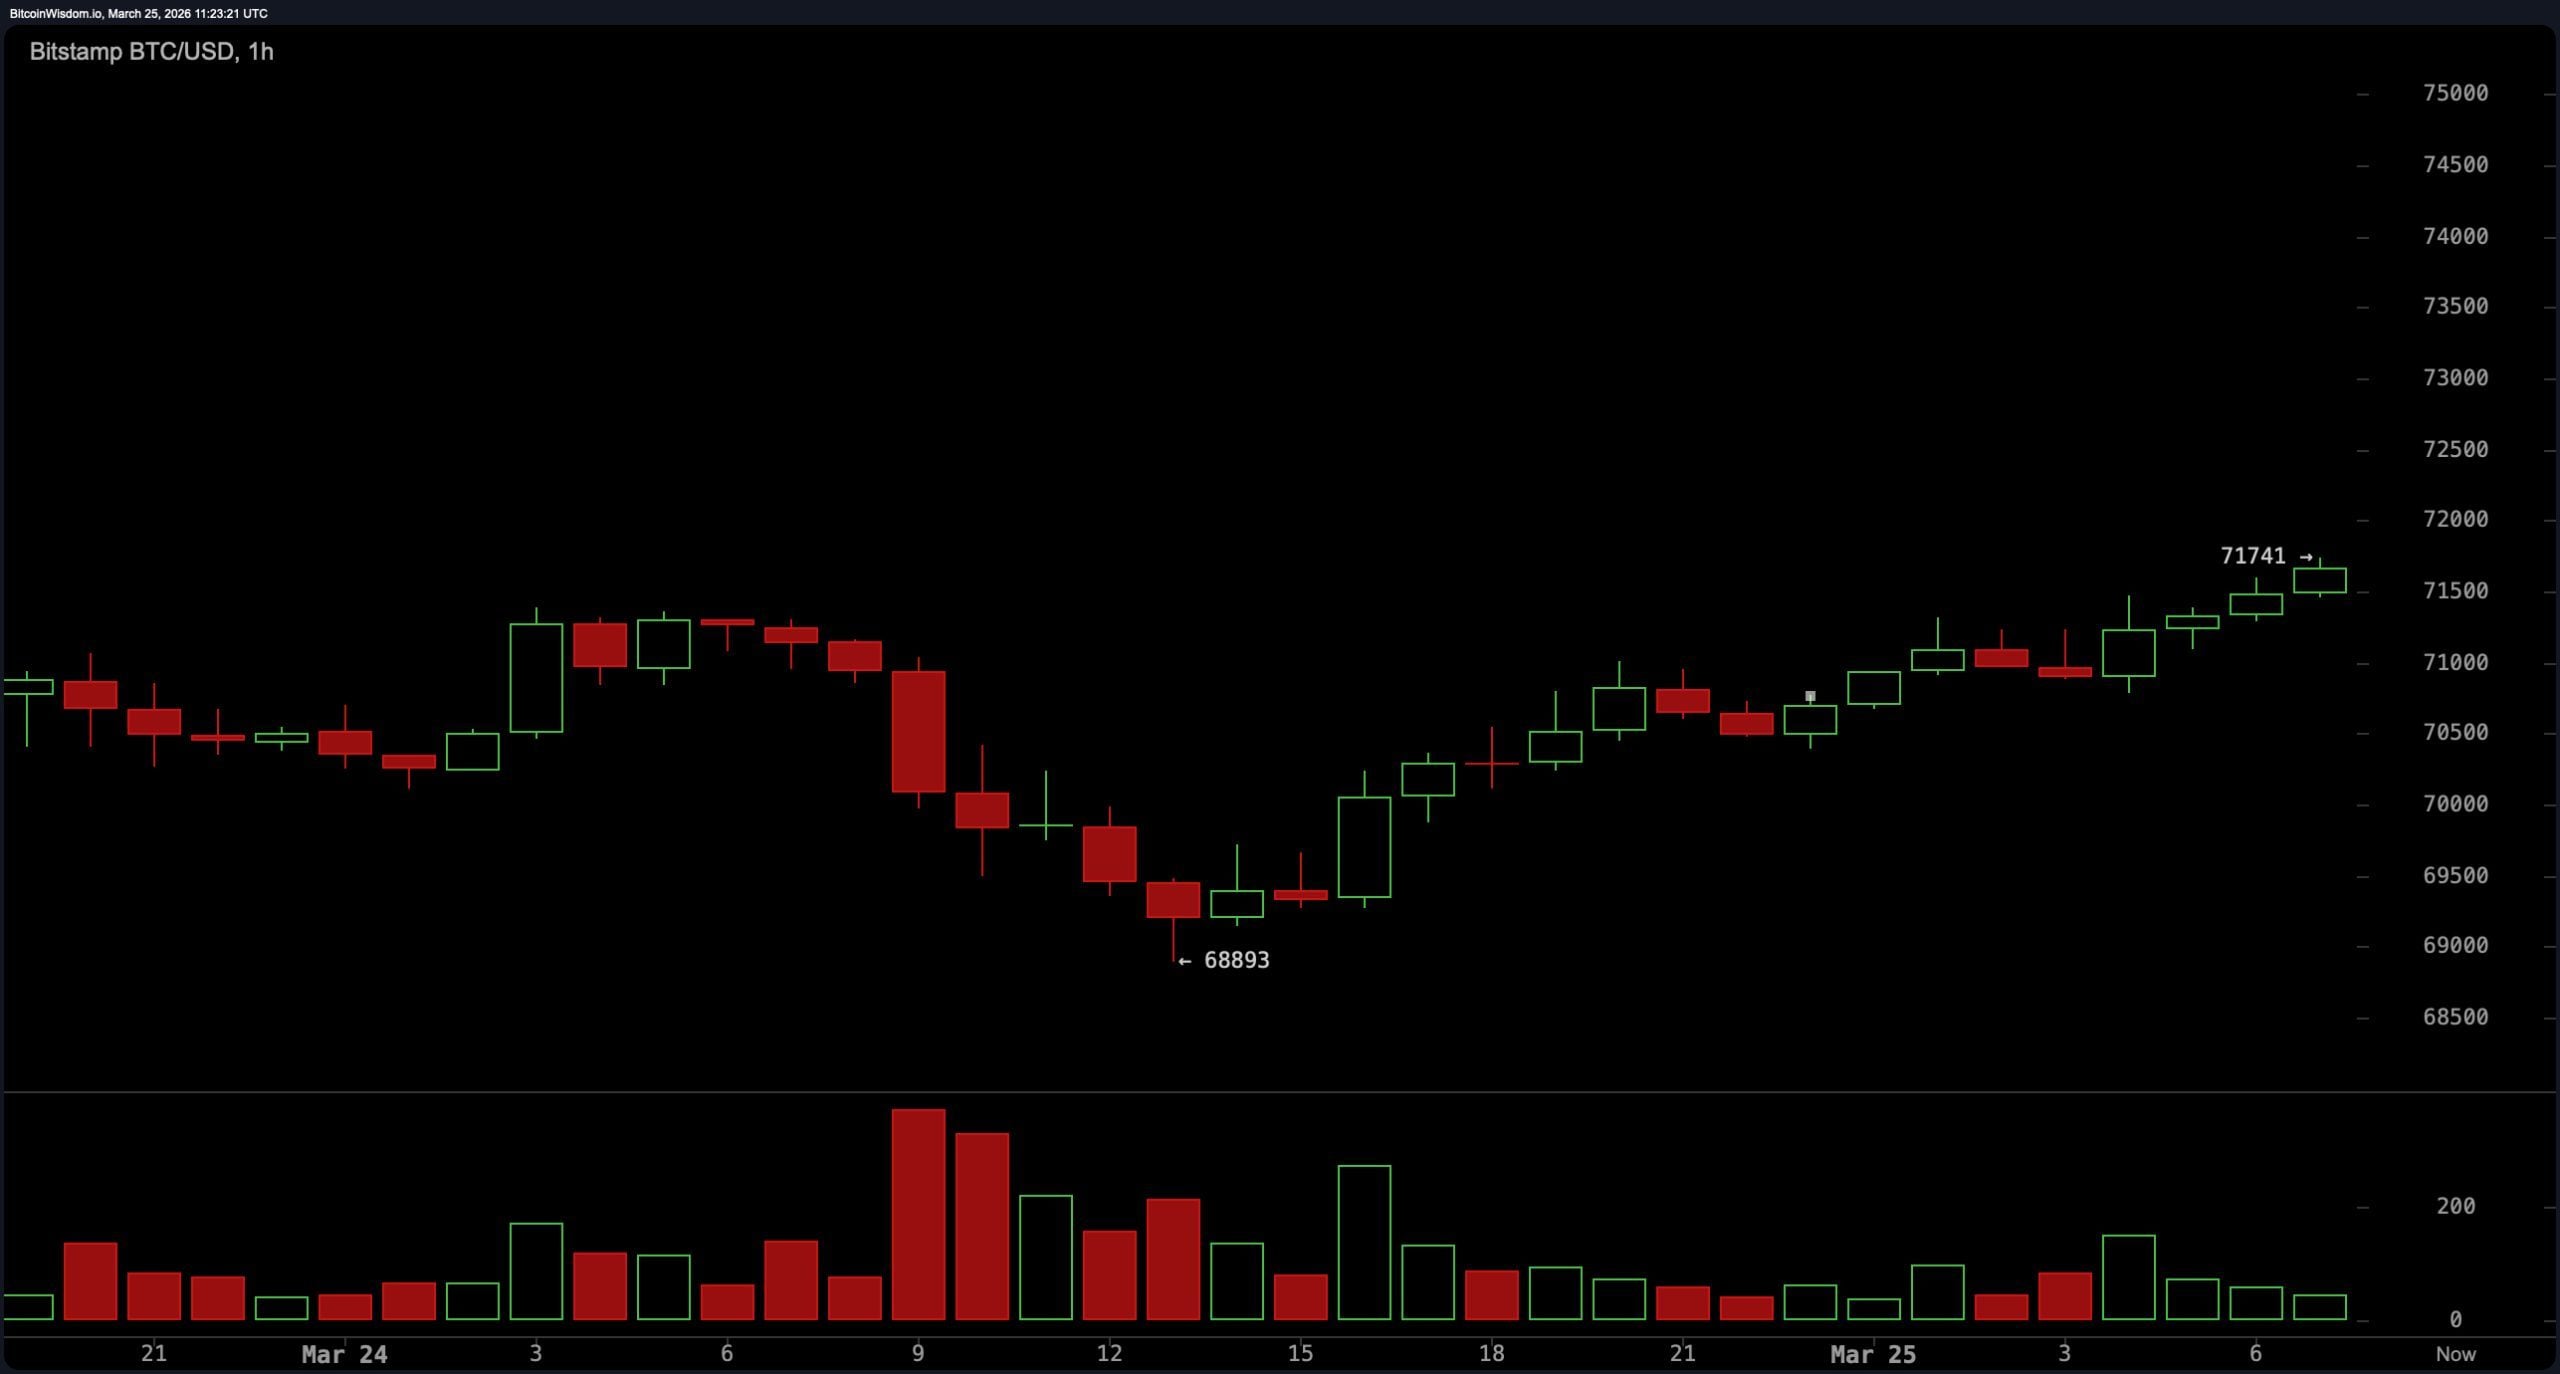
The one-hour chart is the optimist of the bunch, showing a gradual upward progression like someone climbing a hill in flip-flops. But don’t get too excited-it’s approaching resistance without breaking a sweat. Order book data? Tightly clustered bids and asks between $70,539 and $70,578. Translation: everyone’s here, but no one’s making a move. It’s the crypto equivalent of a stalemate at a game of chicken.
Oscillators? Neutral. RSI at 53, Stochastic at 42, CCI at 37-basically, they’re all shrugging their shoulders. ADX at 17 confirms what we already know: trend strength is about as strong as a wet paper bag. Momentum is negative, but MACD is positive. It’s like Bitcoin can’t decide whether it’s coming or going. Spoiler: it’s not going anywhere fast.
Moving averages, however, are the supportive friends in this drama. Short-term measures are all like, “Hey, we’ve got your back,” while longer-term averages are the stern parents reminding everyone who’s in charge. Stability? Sure. Immediate trend shift? Don’t hold your breath.
Bull Verdict:
Bitcoin’s structure is intact, like a well-built IKEA shelf. Higher lows and steady progression suggest demand is still there. Short-term moving averages are cheering it on. A push through $71,640? Now that would be something to write home about.
Bear Verdict:
But let’s not get ahead of ourselves. Bitcoin’s still stuck below $71,600, and those longer-term moving averages are looming like storm clouds. Neutral oscillators and weak ADX? Not exactly a vote of confidence. If it can’t hold $68,970-$70,000, we might be in for a bumpy ride.
FAQ 🔎
- What’s Bitcoin’s price outlook on March 25, 2026?
Bitcoin is stuck between $68,970 and $71,640, like a car in a traffic jam. - Are Bitcoin’s technical indicators bullish or bearish?
Mixed, like a poorly curated playlist. Neutral oscillators, supportive short-term averages. - What are the key support and resistance levels?
Support at $68,970-$70,000, resistance at $71,640. Because every good story needs a hero and a villain. - Is Bitcoin trending or ranging?
Ranging, like a lazy Sunday afternoon. Weak trend strength, no clear direction.
Read More
- ETH PREDICTION. ETH cryptocurrency
- Dogecoin ETF Smashes Expectations! 🚀
- Maxim Gorky’s Take on the $5T Stablecoin Tsunami and the $BEST Token
- TAO PREDICTION. TAO cryptocurrency
- Toncoin’s Robinhood Ride: Whales, Wags, and Wild Gains 🐳📈
- Why Best Wallet Token is Your New Favorite Crypto Wallet – Young, Hip, and Ready to Disrupt!
- EUR VND PREDICTION
- UAE’s Bitcoin Empire: A Royal Comedy of Digital Wealth!
- BTC PREDICTION. BTC cryptocurrency
- Silver Rate Forecast
2026-03-25 14:58