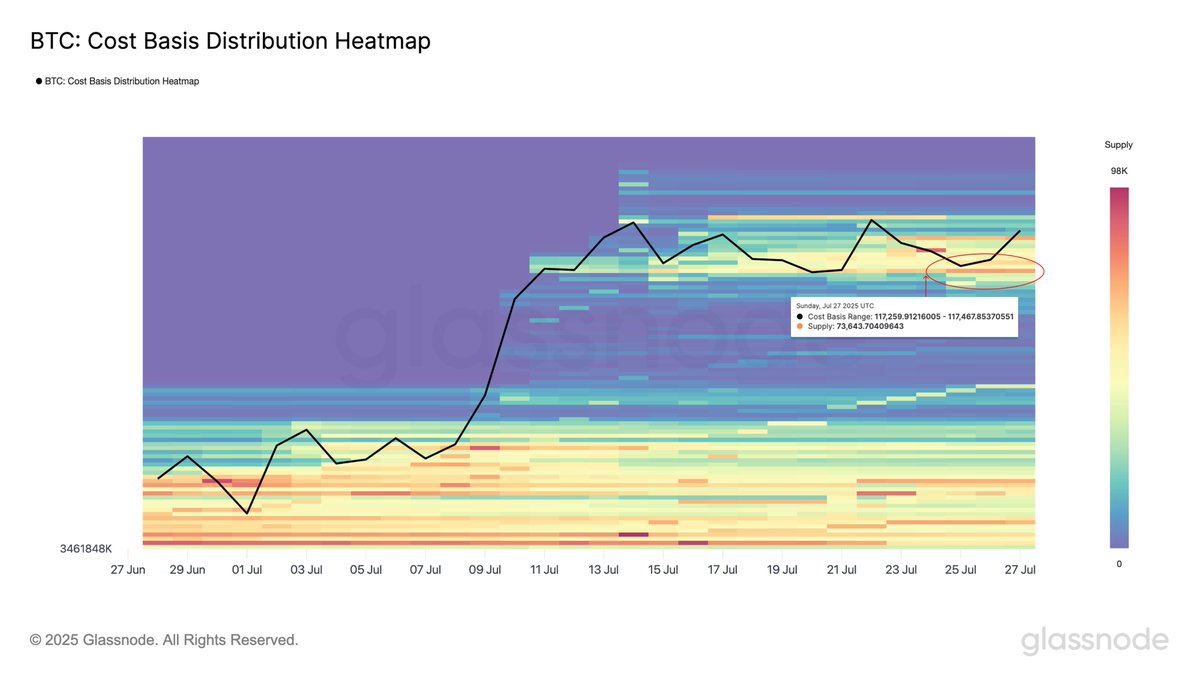
Ah, Bitcoin, the ultimate financial thrill ride 🎢. It’s been stuck in a loop, oscillating between $115,000 and $120,000, leaving everyone wondering when it’ll finally make a move 🤷♂️. But, as it turns out, there’s a sweet spot in this range-bound chaos – $117,000, to be exact 📍. According to Glassnode’s BTC Cost Basis Distribution Heatmap, this level has been a magnet for buyers, making it a crucial support zone 🏰.
The heatmap is like a treasure map, revealing clusters of cost basis activity near key price levels 🏴☠️. It’s clear that $117,000 has been a psychological anchor for bulls, and as long as this zone holds, the risk of a full-blown breakdown remains limited 🚨. But, let’s be real, repeated rejections near $120K and lackluster momentum are raising some eyebrows 🤔. If demand at $117K starts to fade, the price might quickly revisit lower levels in search of fresh support 😬.
$117K: Bitcoin’s Accumulation Stronghold 🏰
It seems that buyers are stepping in on every dip, absorbing selling pressure and stabilizing price action within the current range 📊. Approximately 73,000 BTC are now held at this cost basis, according to Glassnode 📈. This buildup of demand in this area is a testament to investor confidence around this support zone 💪.
What’s unique about this cycle is the presence of legal clarity and accelerating institutional adoption in the US 🇺🇸. It’s like the Wild West, but with more regulations 🤠. This influx of institutional demand is stabilizing the market and making it less reactive to short-term swings 📊.
But, Bitcoin’s calm price action might not last much longer ⏰. As Ethereum gains momentum, driven by rising open interest and on-chain activity, capital is beginning to rotate into altcoins 🔄. Historically, such transitions have marked the end of Bitcoin-led phases and the beginning of broader market expansions 🚀.
BTC Range Narrows As Price Holds Between Key Levels 📊
The 8-hour chart shows Bitcoin consolidating tightly between $115,724 and $122,077, with the price currently hovering around $118,762 📈. Despite a lack of strong momentum, the structure remains bullish as BTC holds above all major moving averages 📊.
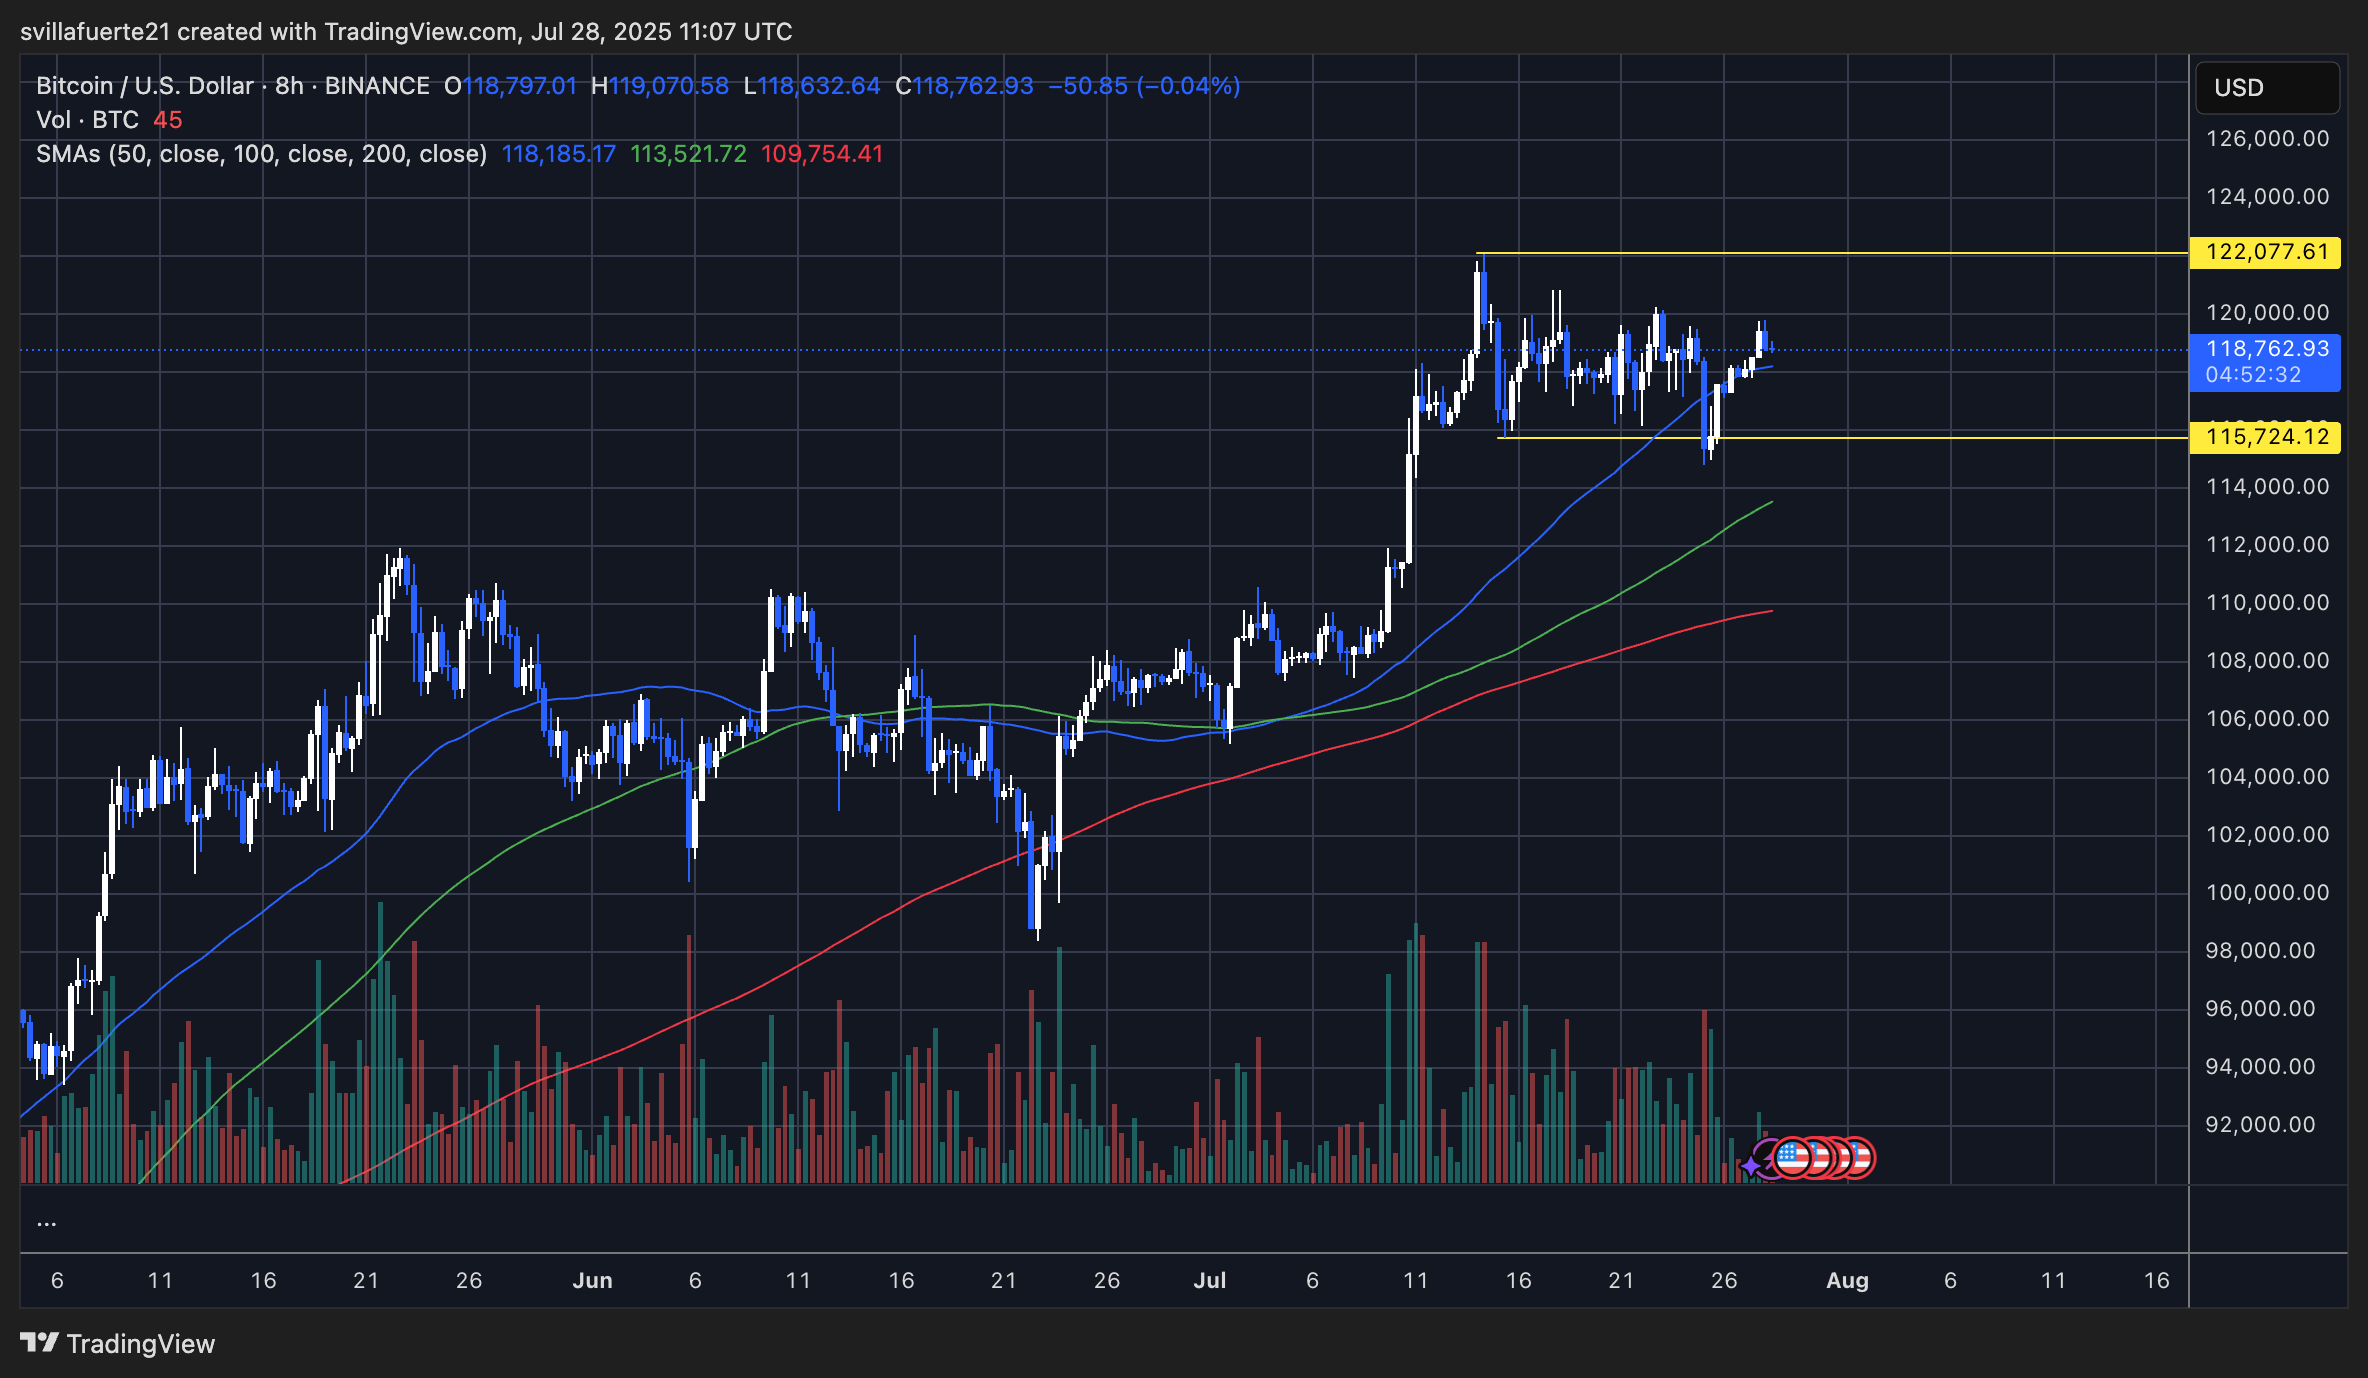
Volume has declined during the consolidation, a typical sign of a neutral phase where market participants await a breakout 🤔. If BTC can reclaim $120,000 with a strong surge in volume, a breakout toward new all-time highs above $123,000 becomes likely 🚀. Conversely, a breakdown below $115,700 could trigger a sharper correction toward the 100 SMA around $113,500 😬.
For now, all eyes remain on whether bulls can sustain pressure and flip resistance, or if sellers regain control near the top of the range 🤔. The current setup favors patient accumulation as the market prepares for its next directional move 📈. So, sit back, relax, and enjoy the Bitcoin rollercoaster 🎢.
Read More
- Nevada Slaps Kalshi with 14-Day TRO-Prediction Markets in Jeopardy!
- UK Cracks Down on Crypto Exchange with a Side of Fake IDs and Big Military Money
- Brent Oil Forecast
- 🤑 Crypto ATM Scams: Will Senators Save Grandma’s Fortune? 🕵️♂️
- SUI’s Descent into Madness: Bulls, Bears, and Crypto Despair 😱📉
- EUR INR PREDICTION
- Gemini’s Wallet: Web3 Meets Passkeys Without the Crypto Cringe 😂
- Ethereum’s Bullish Dance: When Whales and Governments Waltz Together 🐳gov
- Ethereum’s $1,967 Gambit: Win or Lose?
- Uniswap Outwits Fraudulent Fools in Legal Farce!
2025-07-28 21:05