Behold, the digital darling, Bitcoin, prances upon the stage of finance, priced at a staggering $78,634 as of February 1, 2026. Its market capitalization, a mere $1.57 trillion, swells like a puffed-up peacock, while its trading volume, $83.65 billion in the past 24 hours, froths with the frenzy of a mob at a fire sale. Intraday, it pirouettes between $77,082 and $82,733, a performance more tragic than comic, as the market attempts to suture its wounds with the threadbare cloth of hope.
Bitcoin Chart Outlook
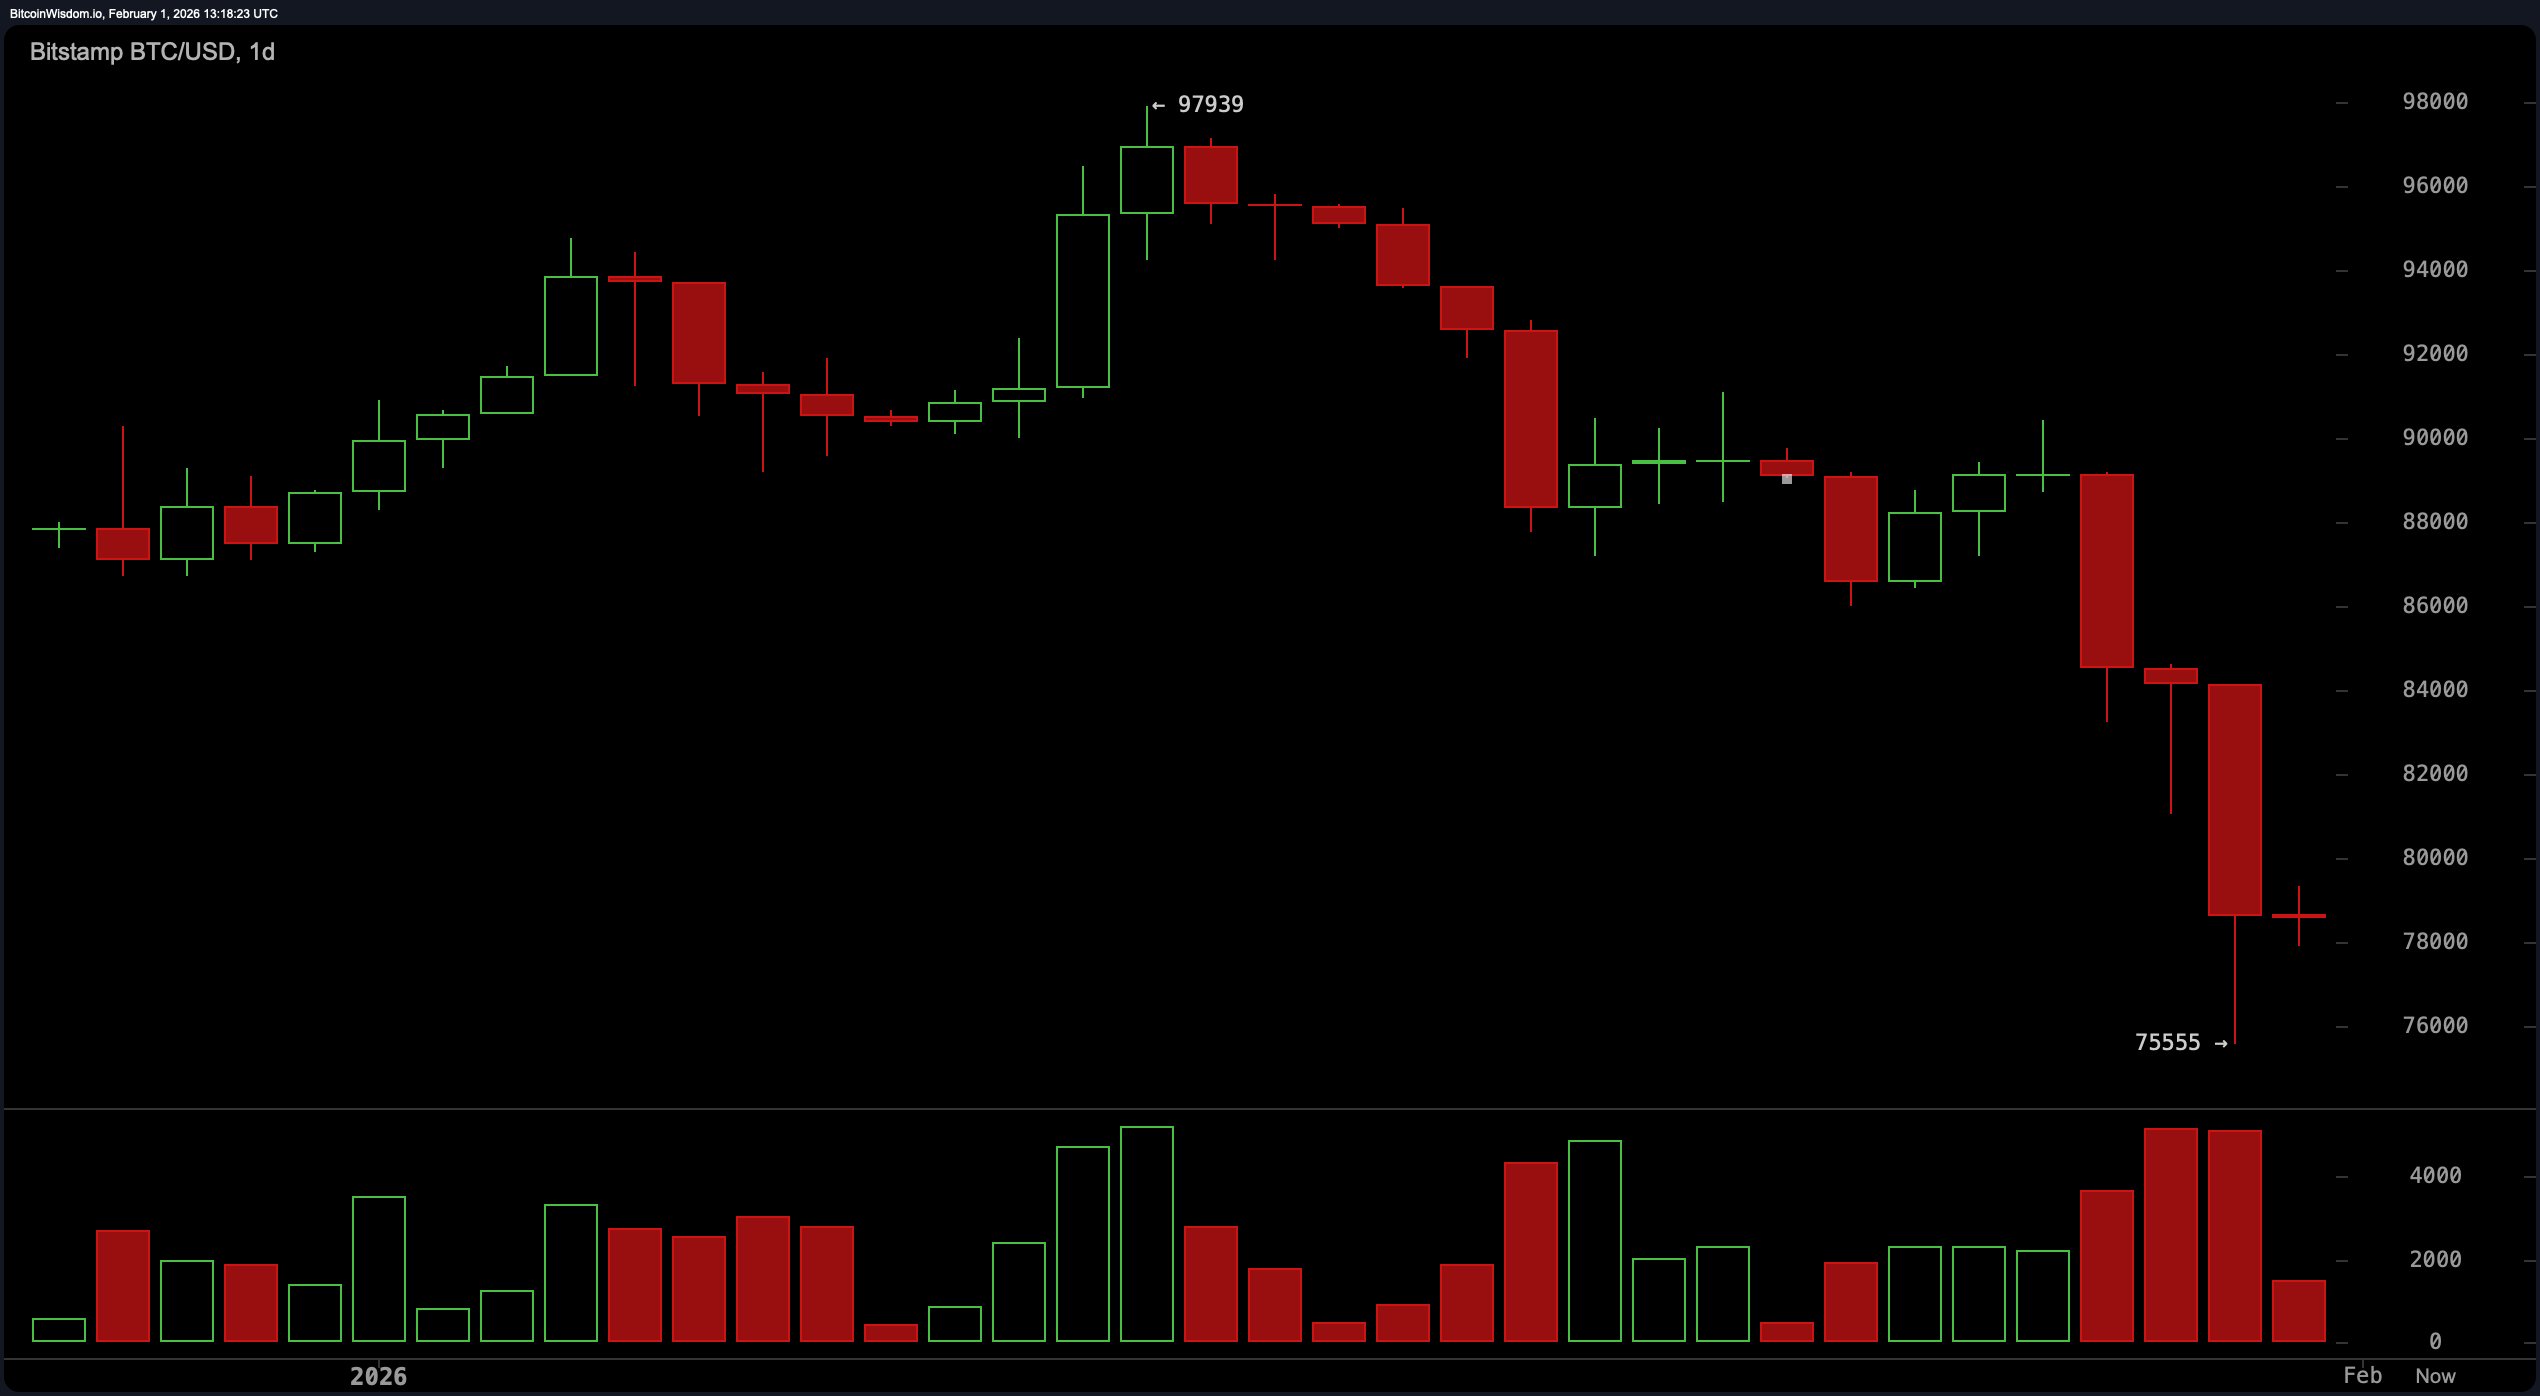
The daily chart, a canvas of despair, reveals a tableau of shattered dreams and broken levels. After a precipitous plunge through the $88,000-$90,000 range, our protagonist, Bitcoin, executes a dramatic nosedive into the $75,500 abyss. This is no genteel decline, but a liquidation-driven farce, confirmed by a spike in trading volume. The result? A long, mournful wick southward and a hesitant stabilization on what one might charitably call a “demand zone.” Traders, those eternal optimists, cling to the hope of a daily close above $86,000, though anything less is but a mirage in the desert of despair.
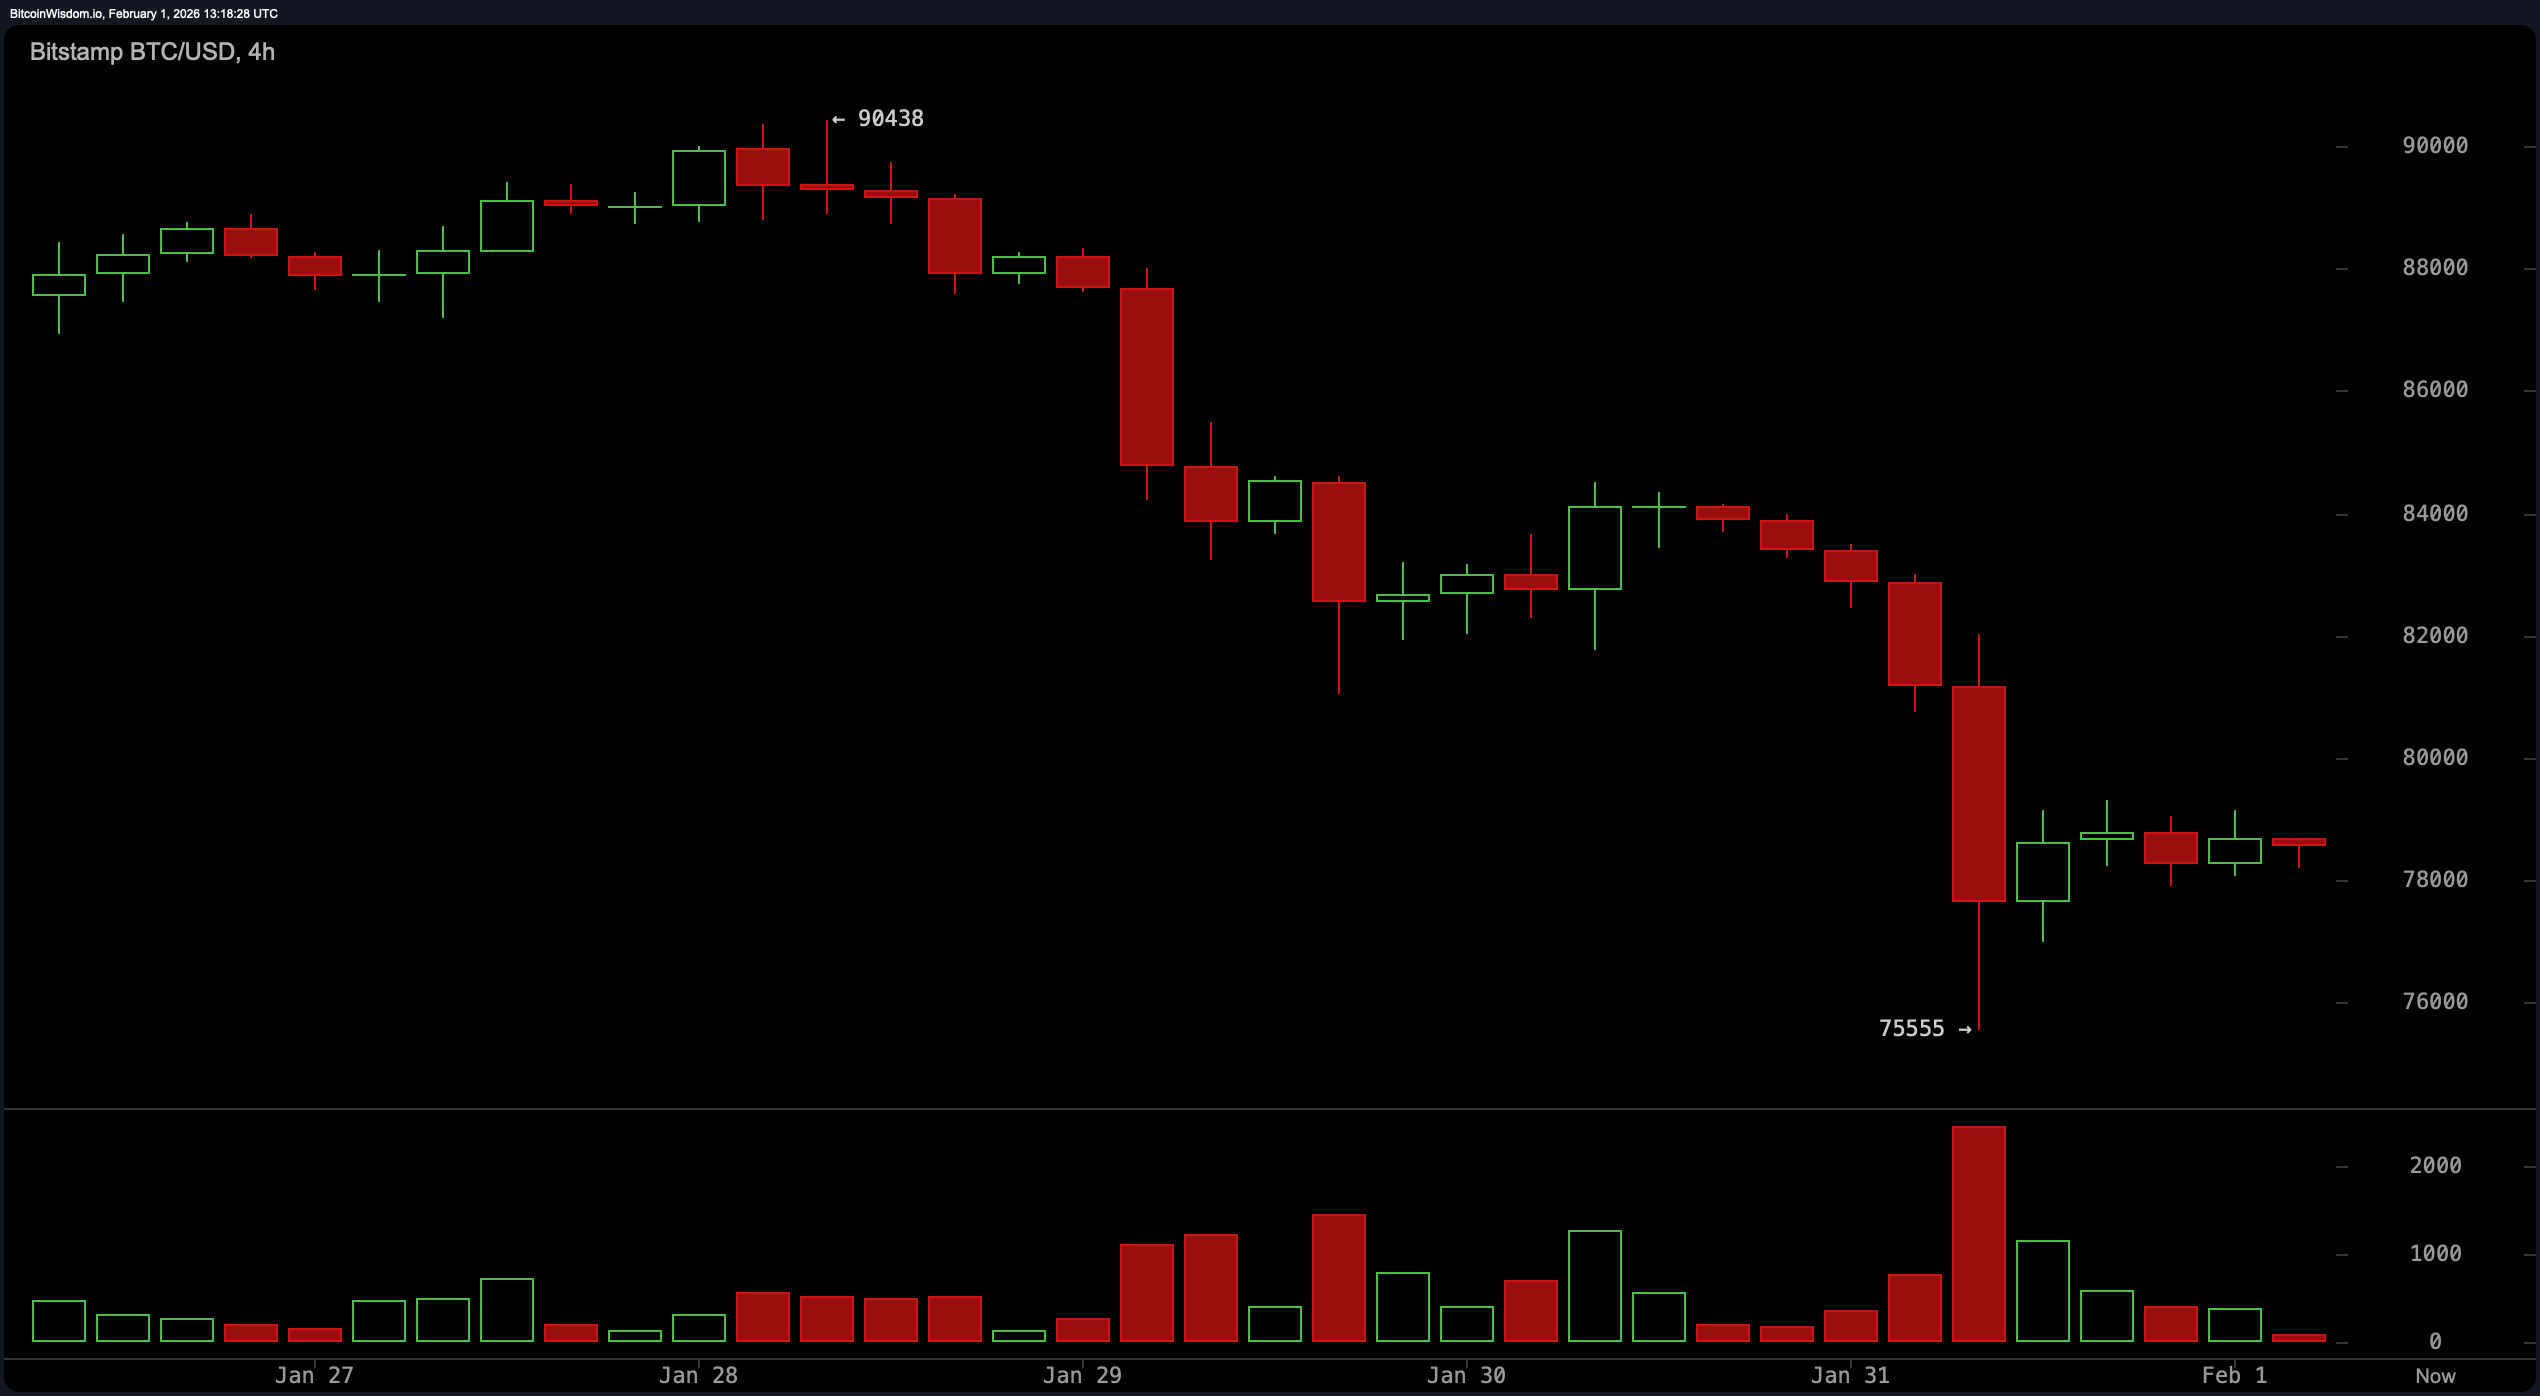
On the 4-hour chart, the scene shifts to a therapy session: consolidative, indecisive, and laden with emotional baggage. The price prints slightly higher lows, yet they lack the conviction of a lover’s embrace. The volume at the bottom of the range suggests sellers are pausing to catch their breath-for now. The battlegrounds are set at $76,000-$77,000 for the tactically inclined, while $84,000 looms as the ex-lover, ready to reject any advance. Unless Bitcoin reclaims $80,500 with vigor, every rally is but a siren’s call, luring the unwary to their doom.
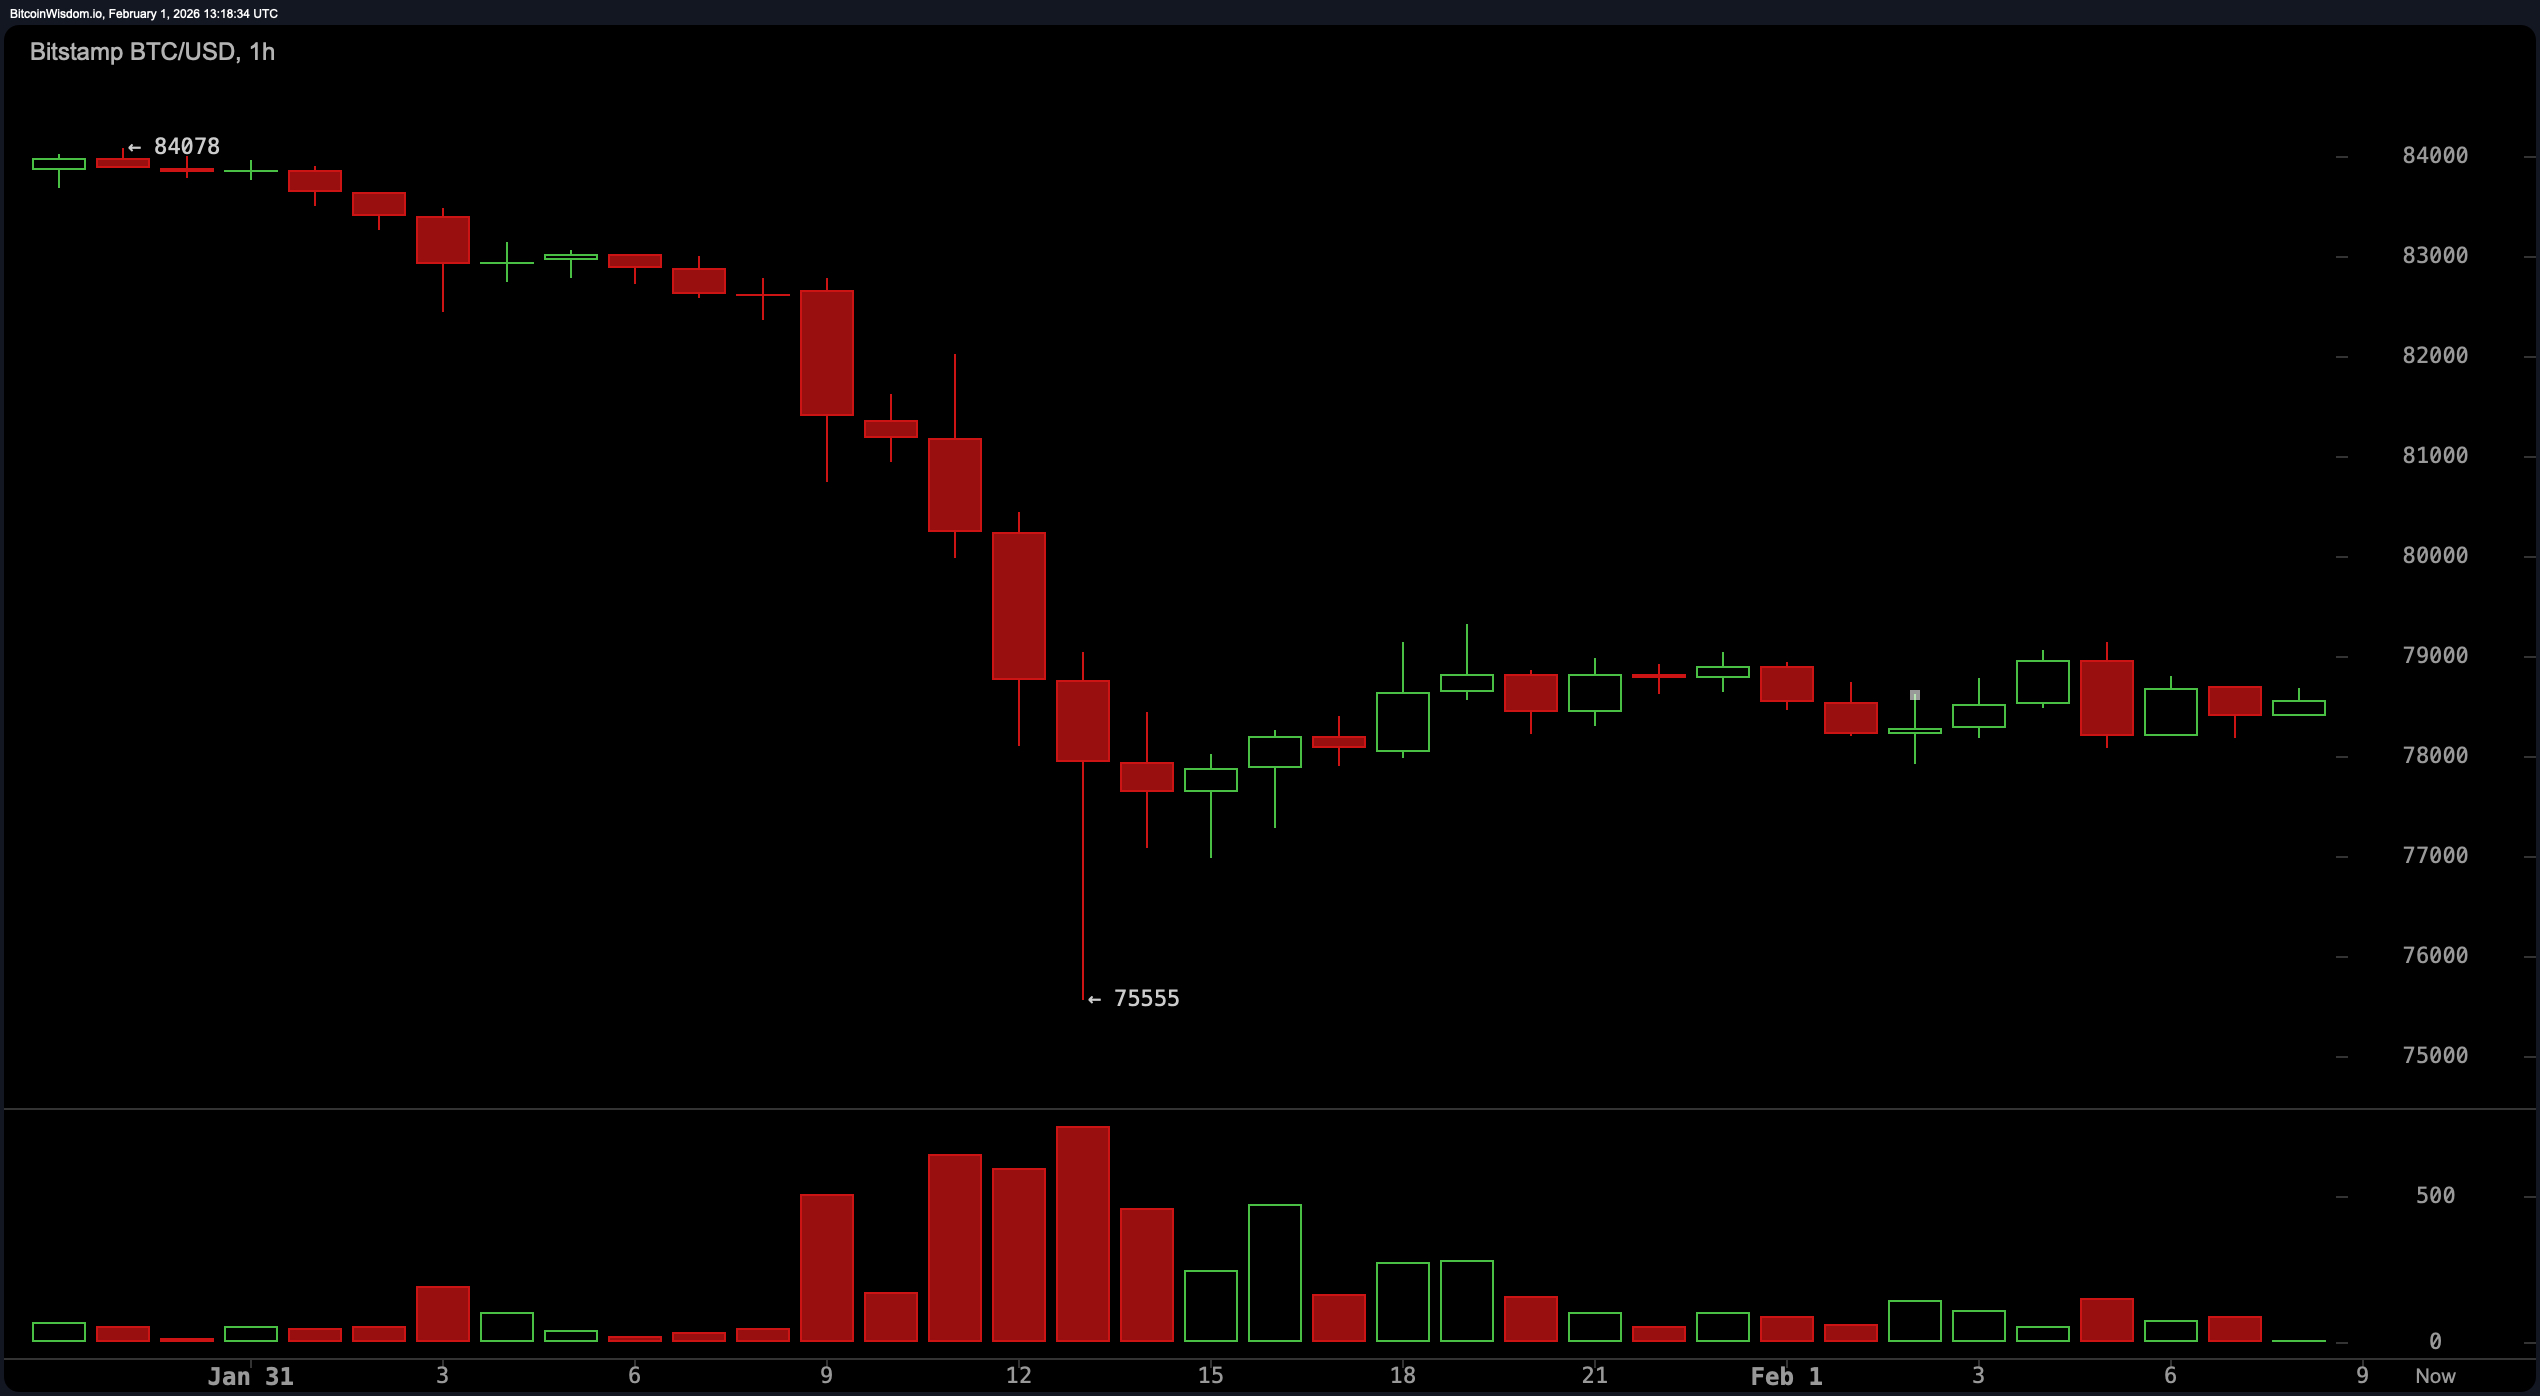
Zooming in to the 1-hour chart, we find ourselves in the twilight zone of crypto price action: a no-man’s land of indecision. Bitcoin ping-pongs between $77,800 and $79,500, its momentum as flat as last week’s soda. Buyers appear, but their commitment is as fleeting as a summer fling. Breakouts from this range require robust volume confirmation, lest they become mere fakeouts, embarrassing the latecomers. Watch $80,500 on the upside and $77,200 on the downside for the next act in this drama.
The oscillators, those dour critics, are hardly in a festive mood. The RSI languishes at 25, while the Stochastic oscillator is even more morose at 18. The CCI, at −195, hints at oversold conditions, but this is a setup, not a salvation. The ADX, at 30, suggests just enough trend strength to keep the plot convoluted. The momentum indicator, a woeful −10,874, and the MACD level at −2,509, both imply that gravity still holds sway over this digital Icarus.
As for the moving averages (MAs), they present a graveyard of failed support. Every major EMA and SMA, from the 10-period to the 200-period, sits high above the current price, waving like ghosts from the rearview mirror. The 10-period EMA at $84,768 and the 200-period SMA at $103,952 are but distant memories. Until Bitcoin reclaims these zones, the broader trend remains shackled by resistance. Recovery is not impossible, but it dines alone, a solitary figure in a crowded room.
Bull Verdict:
For the incorrigible optimists, Bitcoin holds the line at a key demand zone. With oscillators flashing oversold and sellers showing signs of fatigue, a bounce is plausible-especially if $80,500 is reclaimed with conviction. Yet, until the structure flips above $86,000, any upward move is but a tactical feint, not a triumphant march.
Bear Verdict:
The trend, that fickle frenemy, remains bearish. Bitcoin languishes below every key moving average, and momentum indicators point southward with no hint of exhaustion. Unless the price reclaims $86,000 and brings volume to the party, rallies will be snuffed out faster than a meme coin in a bear market.
FAQ ❓
- Where is Bitcoin’s key support level now?
Bitcoin clings to support between $75,500 and $76,000, a thin lifeline in a sea of uncertainty. - What resistance levels could cap Bitcoin’s rebound?
Overhead resistance looms between $84,000 and $86,000, a formidable barrier to any ascent. - Is Bitcoin in an uptrend or downtrend?
Bitcoin remains in a short-term downtrend across all major timeframes, a prisoner of its own making. - What level changes the bearish outlook?
A sustained move above $86,000 with strong volume would shift the bias, though such a feat seems as likely as a snowstorm in July.
Read More
- BTC Plummets: Fed Cuts Ignored in Crypto’s Absurdist Farce! 🤡💸
- Ripple Swoops in on Bitcoin’s Heels: 2030 Gold Rush
- OpenAI Just Made AI Models Free – Because Who Doesn’t Love Free Stuff?
- Silver Rate Forecast
- Bitcoin’s Laziest Coins Finally Roll Off Couch-What Happens Next Will Blow Your Mind! 🍿
- XRP’s Little Dip: Oh, the Drama! 🎭
- Will SUI Soar to $7 Despite 6% Plunge? 📈🚀
- Pasternak’s Hot-ETH Ticket: Half a Billion Bucks & the Moon’s Already Jealous!
- Get Ready for Ether’s Dramatic Ascent-More Than Just a Craving for Fame! 🚀💥
- A Gentleman’s Guide to Dogecoin’s Imminent Gallop-Or Perhaps a Tumble
2026-02-01 18:13