Oh, darling, Bitcoin’s doing its usual tap dance at $114,299 – quite the sum to blow on a Digital Whisper. With a market value of about $2.27 trillion, one might say it’s the Queen Bee of cryptocurrencies. Yesterday’s turnover? A breezy $35.08 billion, with prices swinging between $112,770 and $114,883 – like a teenager’s mood swings, only more expensive. 💸
Bitcoin
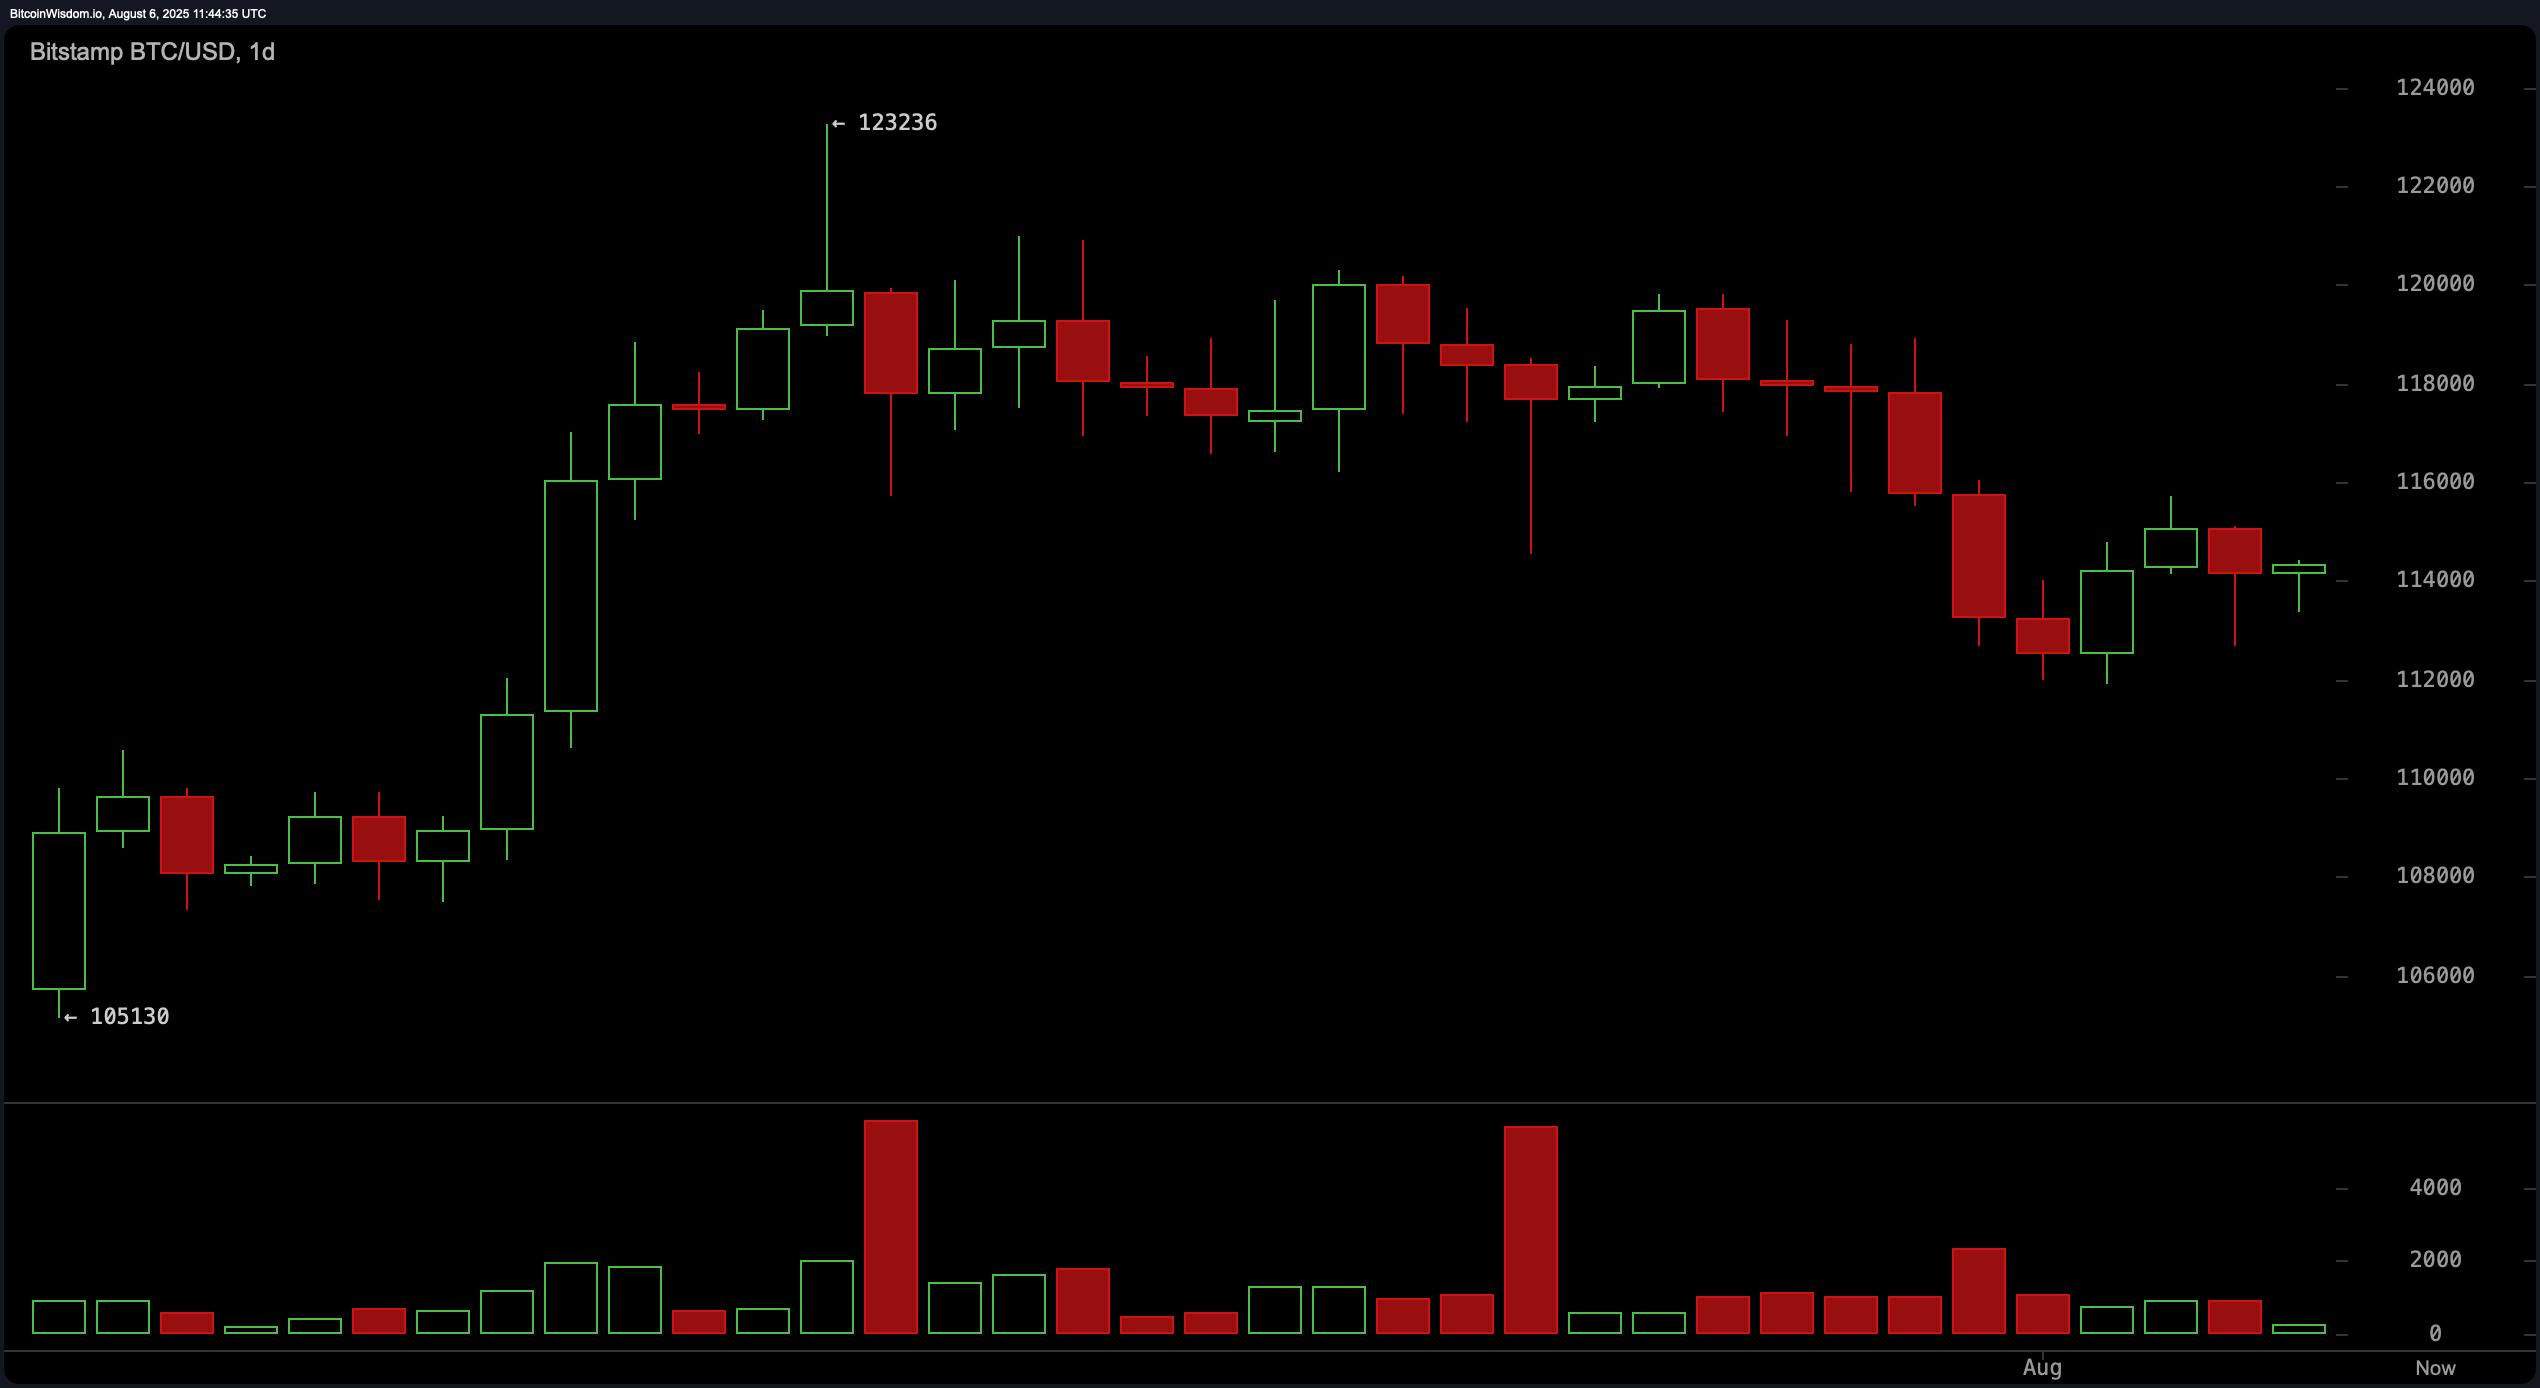
The daily chart shows our elusive star rallied from a modest $105,130 to flirt near $123,236 before quietly slipping back into its corner at around $114,000. Volume surged at the high notes, hinting at a bit of a redistribution – like passing the baton at a fancy dance – and now, it’s doing its double-top impression, with lower highs that suggest it’s playing hard to get. Resistance squads are lurking at $118,000-$120,000, while the ever-important support zone is at $112,000; a decisive tumble below might just cause a quick tumble – a real panic at the crypto disco. The near-term looks bearish, but unless the buyers step up and reclaim $118,000, it’s a game of wait and see. 🍸
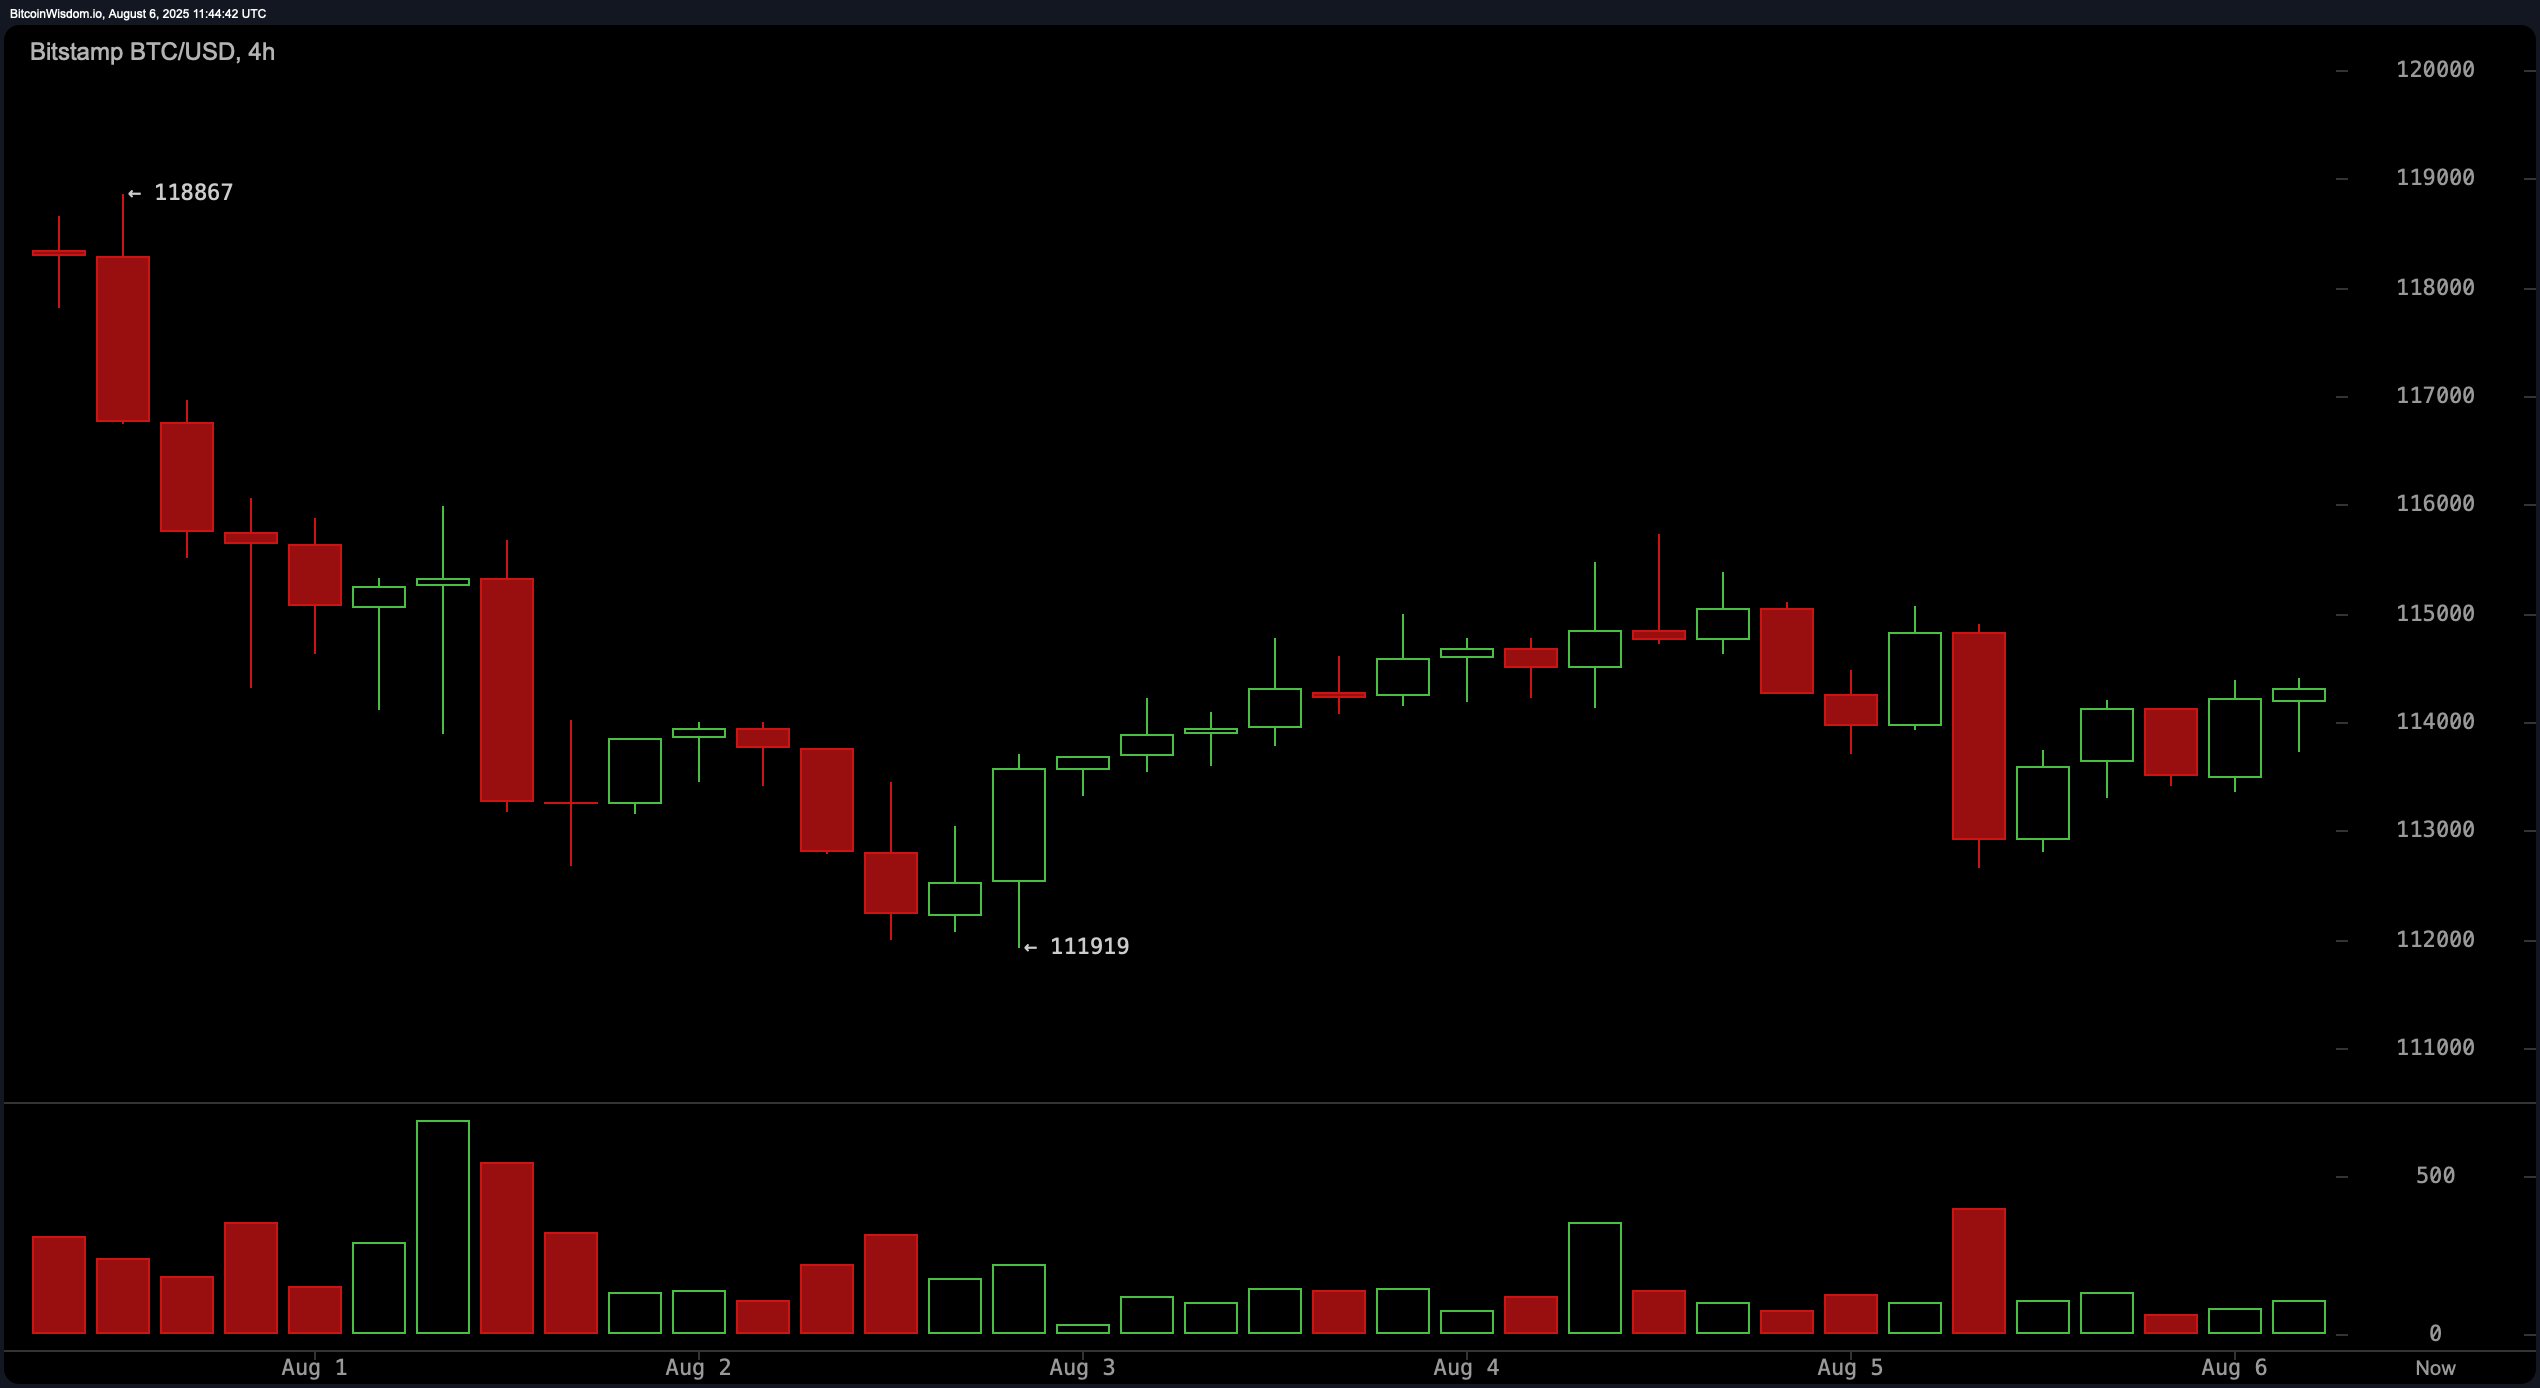
Moving on to the four-hour act: Bitcoin’s momentum has been waning since its hoopla on August 1, tumbling down to $111,919, with a brief rebound that feebly tried to hit $115,000 but couldn’t quite hang there. Volume, the party pooper, continues to outshine buyers during declines, making it look like a bear’s playground. It’s coiling in what seems to be a bearish little flag-either it busts out bullishly at $115,500, or it shrinks back to $113,000, dragging us down to the daily support zone. More intrigue than a Victoria Beckham wardrobe. 🐻
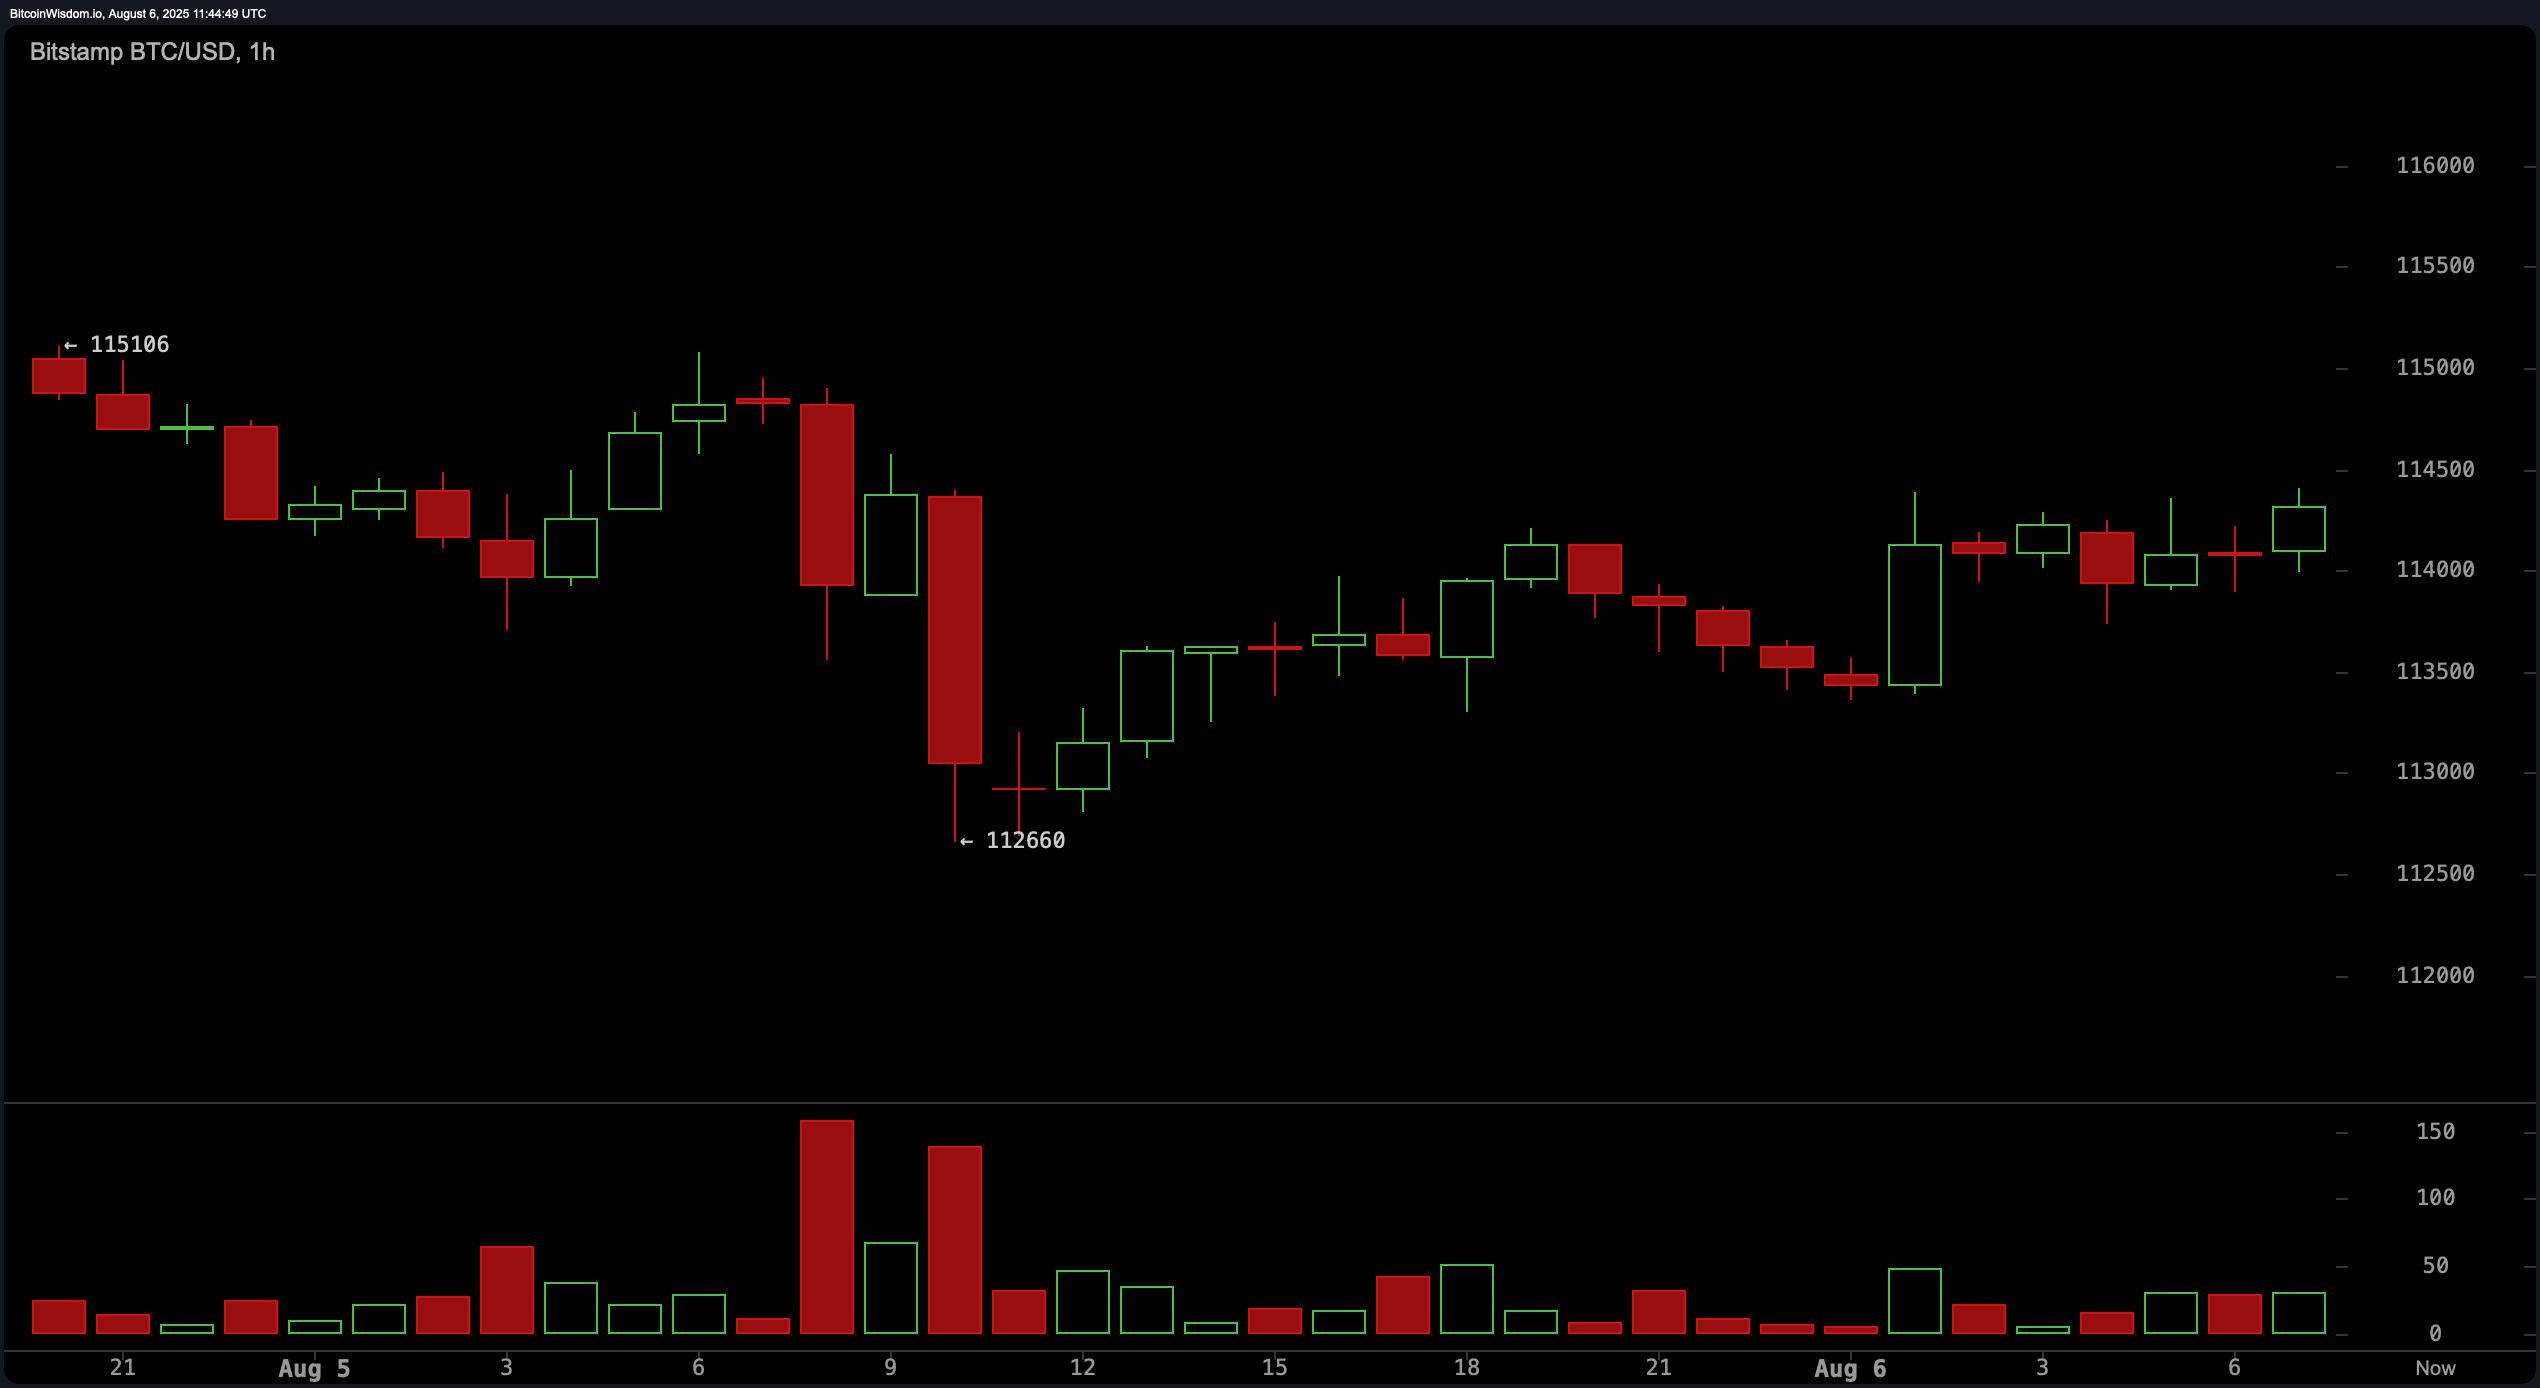
Now, the hourly cha-cha-choppy as ever-forms a descending channel, with lower highs, as sellers hold the floor tighter than a bank vault. Traders are eyeing $115,500 for a potentially bullish breakout (fingers crossed) but should brace for a tumble below $113,000, which might just send us tumbling down the liquidity rabbit hole at $112,000. Drama, darling. 🎭
Oscillators tell a tale of indecision: RSI at a cozy 47, Stochastic whispering sweet nothings at 31, and the CCI showing a bullish -106 – like a shy debutant at her first ball. Meanwhile, ADX tiptoes at 19, bidding us wait; the Awesome oscillator at -1,839 and the momentum at -5,171 scream “sell,” while MACD at 62 whispers “not so fast.” It’s a coin toss, and frankly, darling, I’d bet not to bet. 🎲
Moving-average wise, the short-term EMA and SMA (10, 20, 30 periods) are hanging about $115,009-$116,801 – just above current spot, giving sellers a tug-of-war advantage. But longer-term, the EMA 50 at $113,110 and SMA 50 at $112,645 have turned bullish, with deeper supports like EMA 100 at $108,278 promising safety if things go awry. A bit of a messy ballet between bears and bulls, but the long-term trend is still dancing happily in the background. 💃🏻
Bullish Rumors:
If Bitcoin can rally over $115,500-$118,000 with enough volume, it might just rekindle the upward flirtation, waltzing back to $120,000 and maybe even flirting with that high of $123,236. Support from the slow and steady EMA 50 and SMA 50 only sweeten the deal; the long-term trend remains supportive-well, as supportive as a grand English butler. ☕️
Oh dear, the Bear:
If it can’t hold the $113,000 line, a somber slide to $112,000 looks inevitable, with a further tumble to $108,000 if the seller’s club gets rowdy. The current bear flag on the four-hour chart, with the overhead resistance acting like a pesky bother, keeps the immediate mood decidedly bearish. A true soap opera, darling, and we’re all watching with popcorn. 🍿
Read More
- Gold Rate Forecast
- Silver Rate Forecast
- Bitcoin Booms Again! Whale Frenzy, Hype & a Shot of Hyper to the Moon 🚀
- Ether’s Dance: A Tragic Waltz of Gain and Greed
- 🤑 Bitcoin’s Wild Ride: Bessent’s Backpedal Leaves Markets in a Tizzy! 🌀
- Why BNB Price Almost Broke $1,000 (And Why You Should Care)
- USD HKD PREDICTION
- Bitcoin’s Wild Ride: A Tall Tale of $HYPER Hype & $BTC Lunacy 🐍
- Crypto: The Magical Money That Won’t Vanish (Even If India Tries) ✨
- Bitcoin’s Circus Act: Price Falls, Searches Rise, and Everybody’s Confused 🤡💸
2025-08-06 16:05