The Bitcoin price sits once again smack-dab in the middle of the age‑old crypto debate: is it a bull trap or a genuine recovery? A viral chart on X is waving a stop‑sign at us, claiming the current rally is a perfect echo of 2022 and that BTC will nosedive to $45,000 in twelve days if you let the $73K near‑peak be a “bull trap.” Classic. Classic.
But, you know, when you sort of actually dive into the on‑chain data, the story suddenly looks… less like a global financial apocalypse and more like a mildly disappointing dinner.
Bitcoin Price: Bull Trap or Reset?
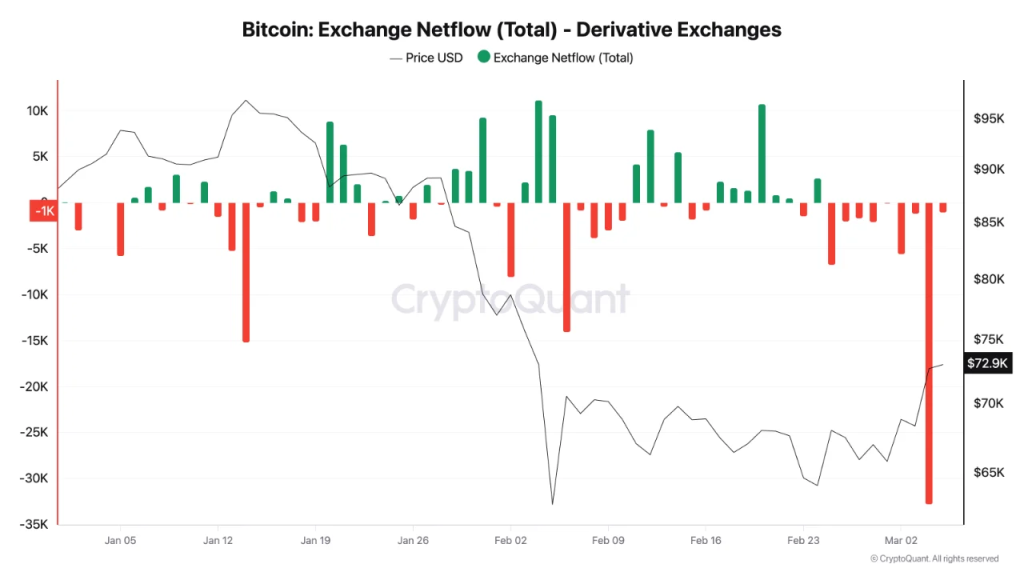
Let’s chat about derivatives first. According to CryptoQuant, over 30,000 BTC left derivatives exchanges as the price toyed with $72,900 in early March 2026.
That’s nothing to sneeze at. Huge outflows from derivatives usually mean shorts are covering rather than piling their bearish bets, which, plot twist, could mean some of the selling pressure that had been drags the chart lower is already fading.
And that matters massively. If the big players see the $65K-$68K sweet spot as a local bottom, then the sudden climb could be less hype‑driven euphoria and more like the market politely redeploying position.
Quiet Accumulation Behind the Scenes
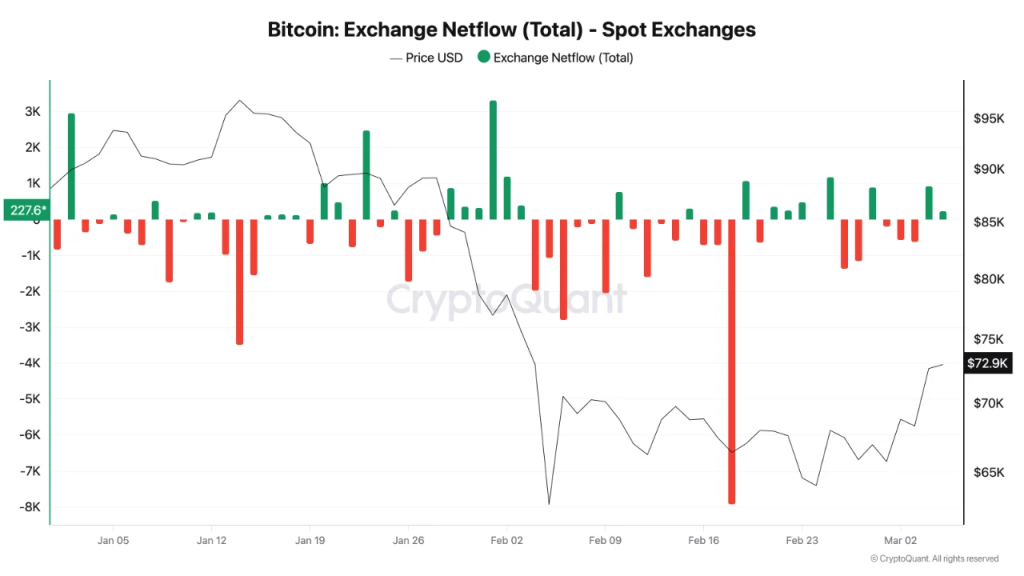
Now, what about the spot market? On February 18, about 8,000 BTC walked off spot exchanges right when prices were low.
They weren’t sold. They were withdrawn-taking the classic “stealth accumulation” vibe: big holders buy when the market’s down and stash the coins in cold storage, avoiding the joke that they’d be dumped later.
For anyone obsessing over that 45k doom prop, this usually reads more like confidence than panic.
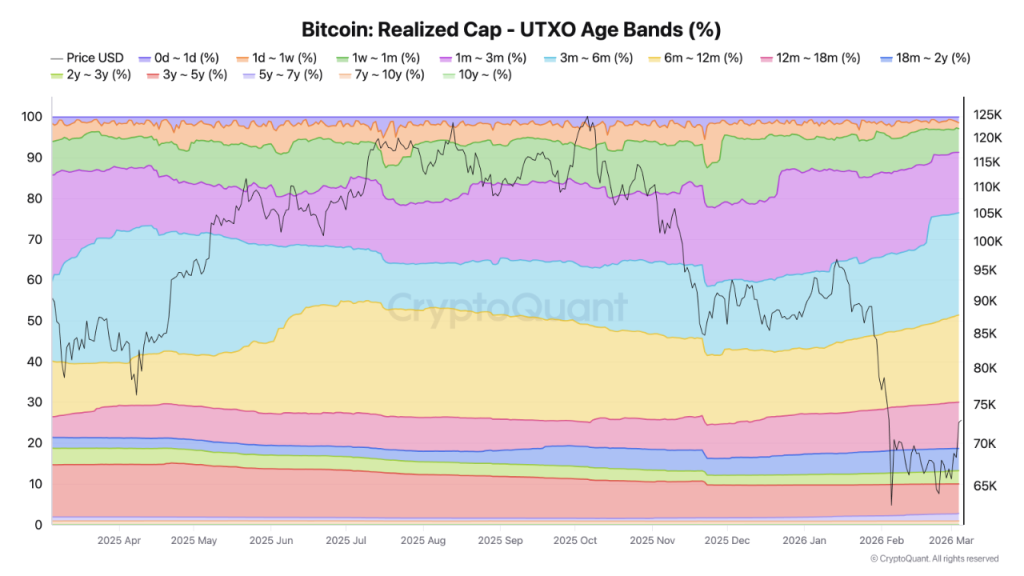
Meanwhile, the so‑called diamond hands long‑term holders haven’t flinched.
Wallets holding Bitcoin for longer than five years are practically the same, and the 6‑ to 12‑month holders are even growing, which suggests investors who went giddy last year’s turbulence are now transitioning to the lazy, long‑term patience lane.
Not exactly the jittery, pre‑crash behaviour you’d expect.
Structural Support Around $70K
Let’s talk mining economics. Marathon Digital told us their average Q4 2025 mining cost sits around $70,027 per BTC. With Bitcoin trading close to $73,000, that gives miners a razor‑thin $3,000 cushion.
That margin essentially acts as a structural floor.
Historically, if the price dips below mining costs, miners can walk out and sell reserves. But this cycle has a twist: some miners are shifting toward AI data centres, which may reduce their urge to liquidate during a downturn.
So, what’s next? Sentiment has moved from “extreme fear” to “optimistic confidence,” yet on‑chain indicators still scream accumulation instead of distribution.
The Bitcoin price might not be heading straight to the moon-though the data doesnt scream imminent collapse either.
For now, that $70,000 line remains the battlefield. The next move on the chart will decide who gets to keep bragging that they were right.
Read More
- Gold Rate Forecast
- USD HKD PREDICTION
- Brazil Ditches Cash?! 💸
- Bitcoin Booms Again! Whale Frenzy, Hype & a Shot of Hyper to the Moon 🚀
- Harvard Sage’s Bitcoin Blunder: Rogoff’s 2018 Prophecy Spectacularly Implodes 🚀😂
- Web3’s Global Tango: Asia’s Retail Flair Meets Western Institutional Swagger
- Why BNB Price Almost Broke $1,000 (And Why You Should Care)
- 🤑 Bitcoin’s Wild Ride: Bessent’s Backpedal Leaves Markets in a Tizzy! 🌀
- Solana’s $200 Gambit: Will This Blockchain Darling Finally Deliver? 🚀
- Grayscale’s Avalanche ETF: A Tale of Hope and Volatility 🚀💰
2026-03-05 18:51