Ah, Bitcoin, the digital gold that’s currently doing the financial equivalent of a tightrope walk while juggling flaming torches. As of June 14, 2026, at 8 a.m. Eastern time, our dear BTC is perched at $64,549 per coin, clinging to the $64,000 zone like a barnacle on a shipwreck. The daily chart looks about as cheerful as a tax audit, with a bearish technical rating, but the lower timeframes are whispering sweet nothings about stabilization after a multi-week nosedive from the giddy heights of $82,969.
-
Key Takeaways (or, as we like to call them, the CliffsNotes for the impatient):
- Bitcoin is trading at $64,549, with 11 out of 14 moving averages (MAs) waving red flags like overzealous traffic wardens.
- BTC’s 1-hour and 4-hour charts are forming higher lows, while the MACD and momentum indicators are doing a little happy dance.
- A close below $59,000 would be like tripping on a banana peel-messy and potentially disastrous, opening the door to the $50,000 zone.
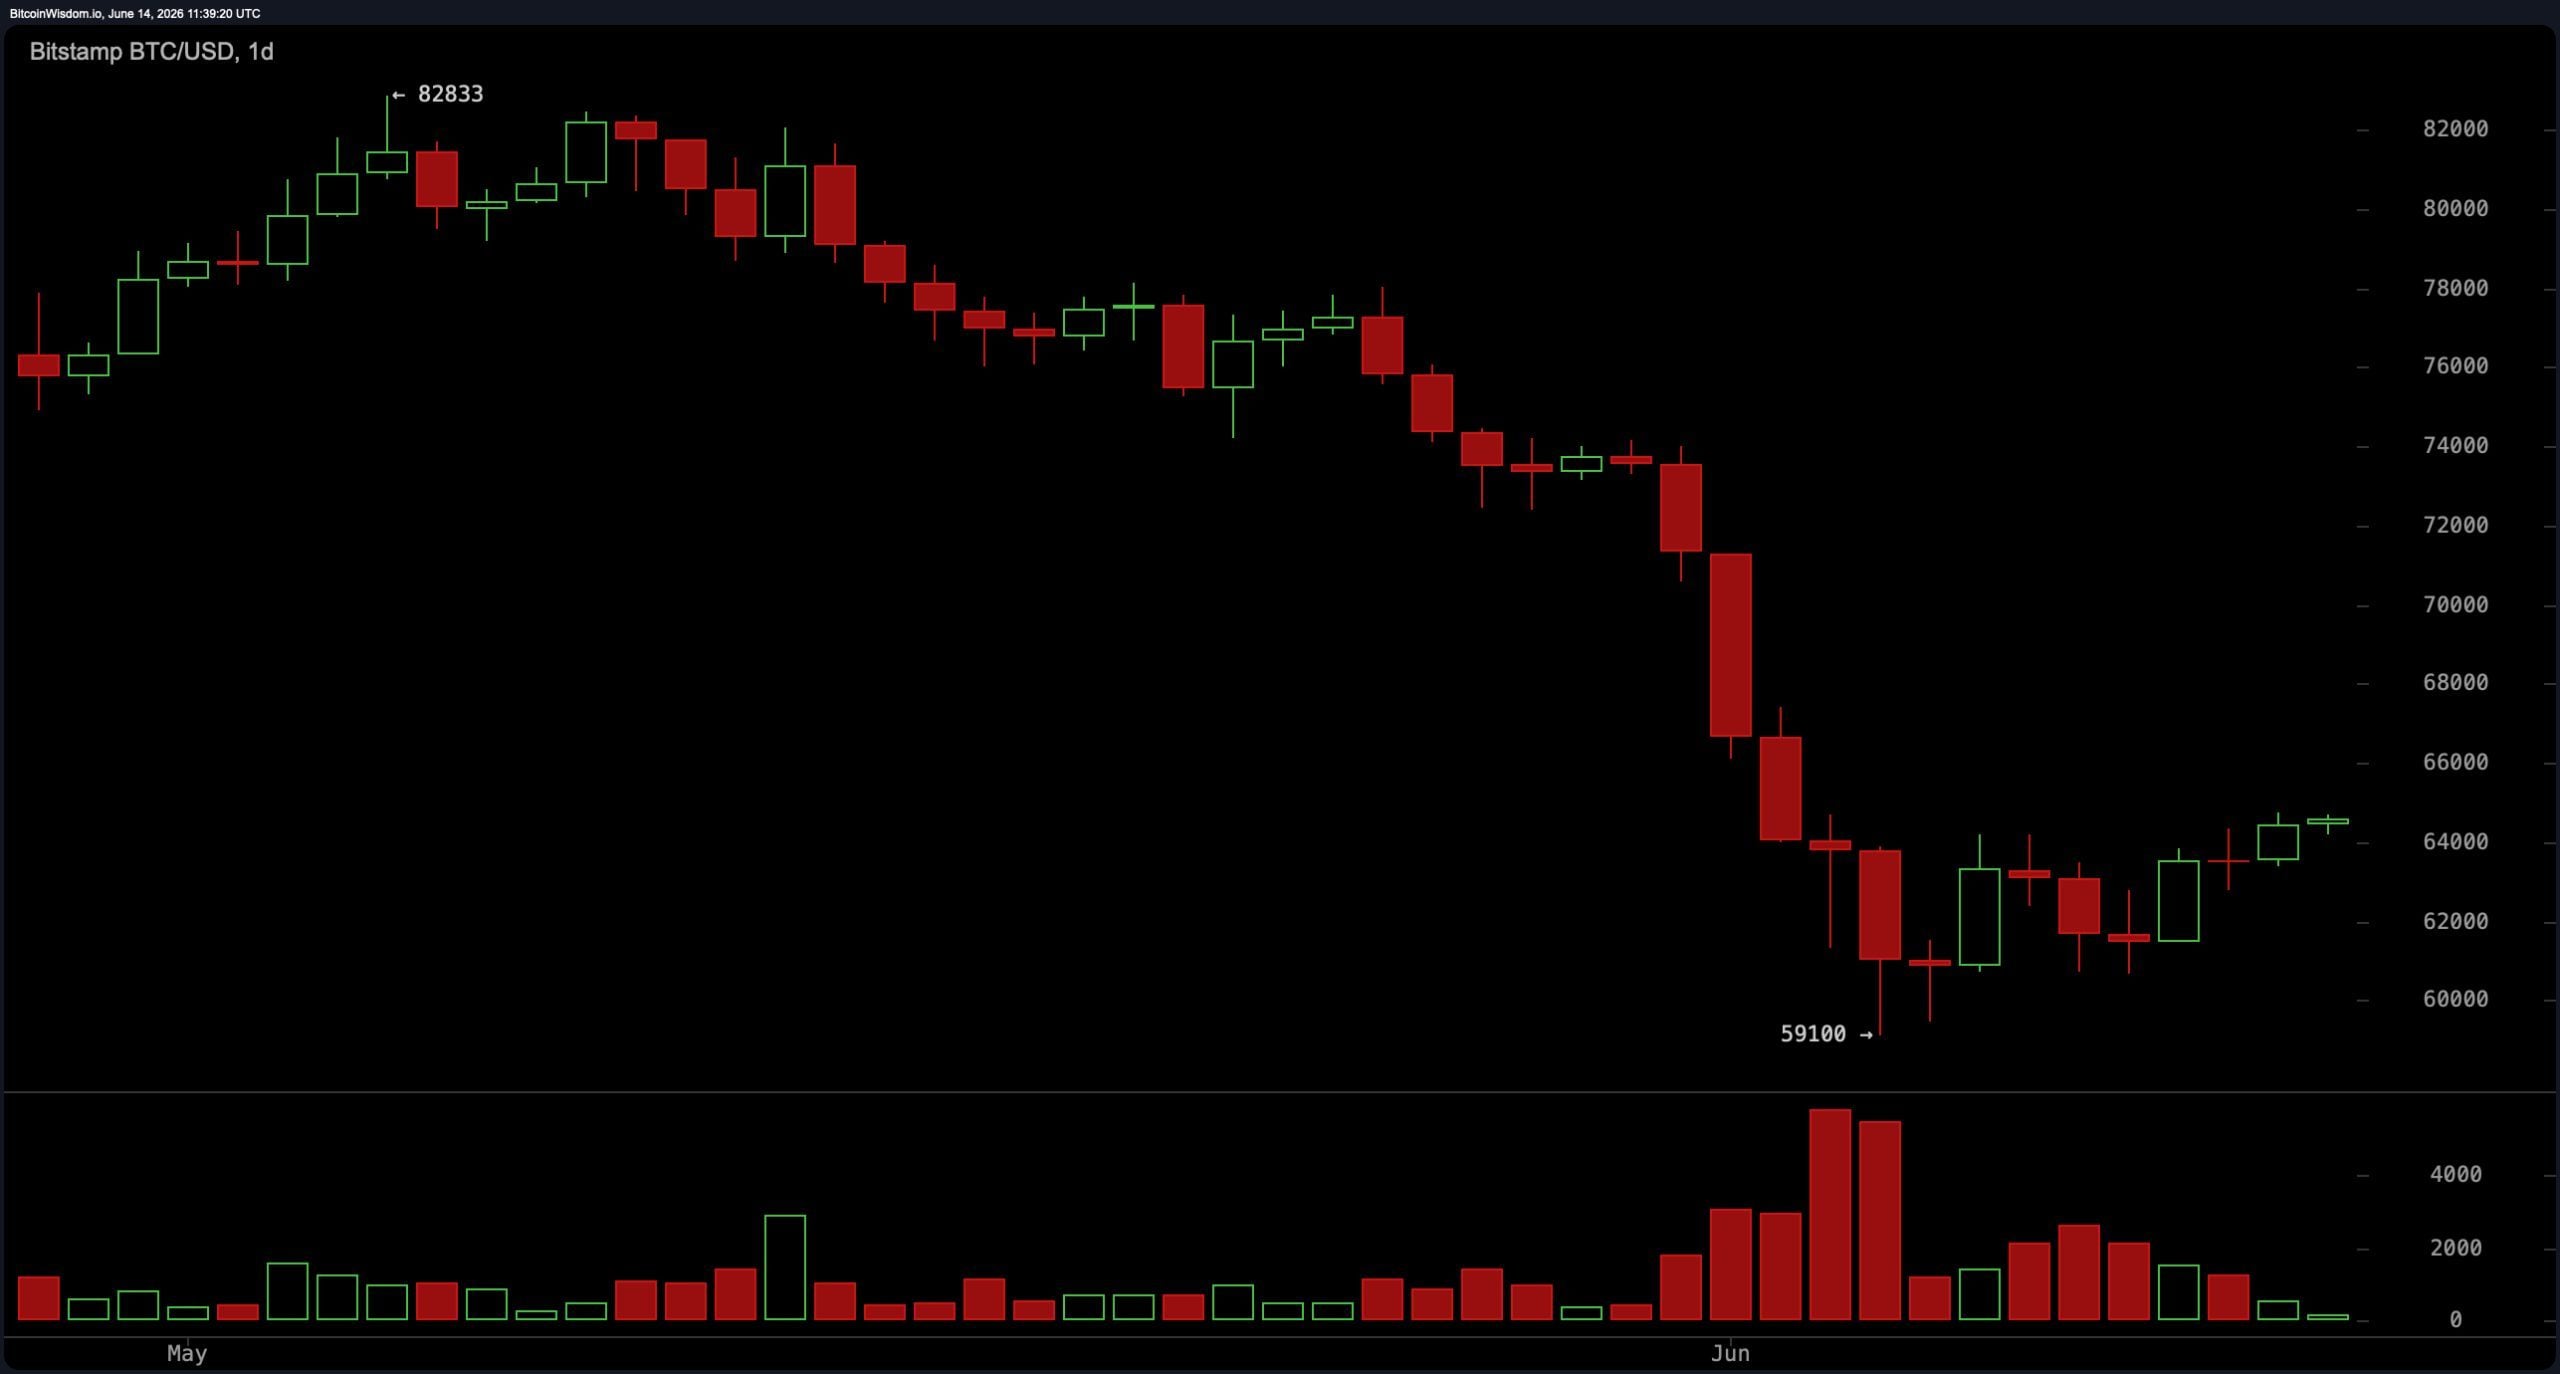
Daily Chart: The Corrective Tango Continues Below the Long-Term Averages
On the daily chart, Bitcoin is still in its corrective phase, like a hangover after a night of too much digital champagne. After peaking at $82,969 in early 2026, it took a tumble to the $59,100 to $59,215 range. Since then, it’s rebounded to the $64,500 area, clinging to the 200-week simple moving average (SMA) like a life raft. Historically, this level has been a sturdy support floor, but let’s not jinx it.
The overall daily technical rating is bearish, thanks to BTC trading below most of the longer-period moving averages. Selling pressure has eased, but volume remains as moderate as a British summer. No confirmed trend reversal yet, so don’t go betting the farm just yet. The $65,000 to $67,000 zone is the next hurdle, and traders are watching it like hawks at a pigeon convention.
4-Hour Chart: Higher Lows Suggest Short-Term Sanity
The 4-hour chart is a bit more optimistic, like a ray of sunshine on a cloudy day. Bitcoin is forming higher lows after the sharp selloff that sent it tumbling to the $59,000 area. This higher-low structure, coupled with easing oversold conditions, hints that the aggressive downside momentum might be running out of steam.
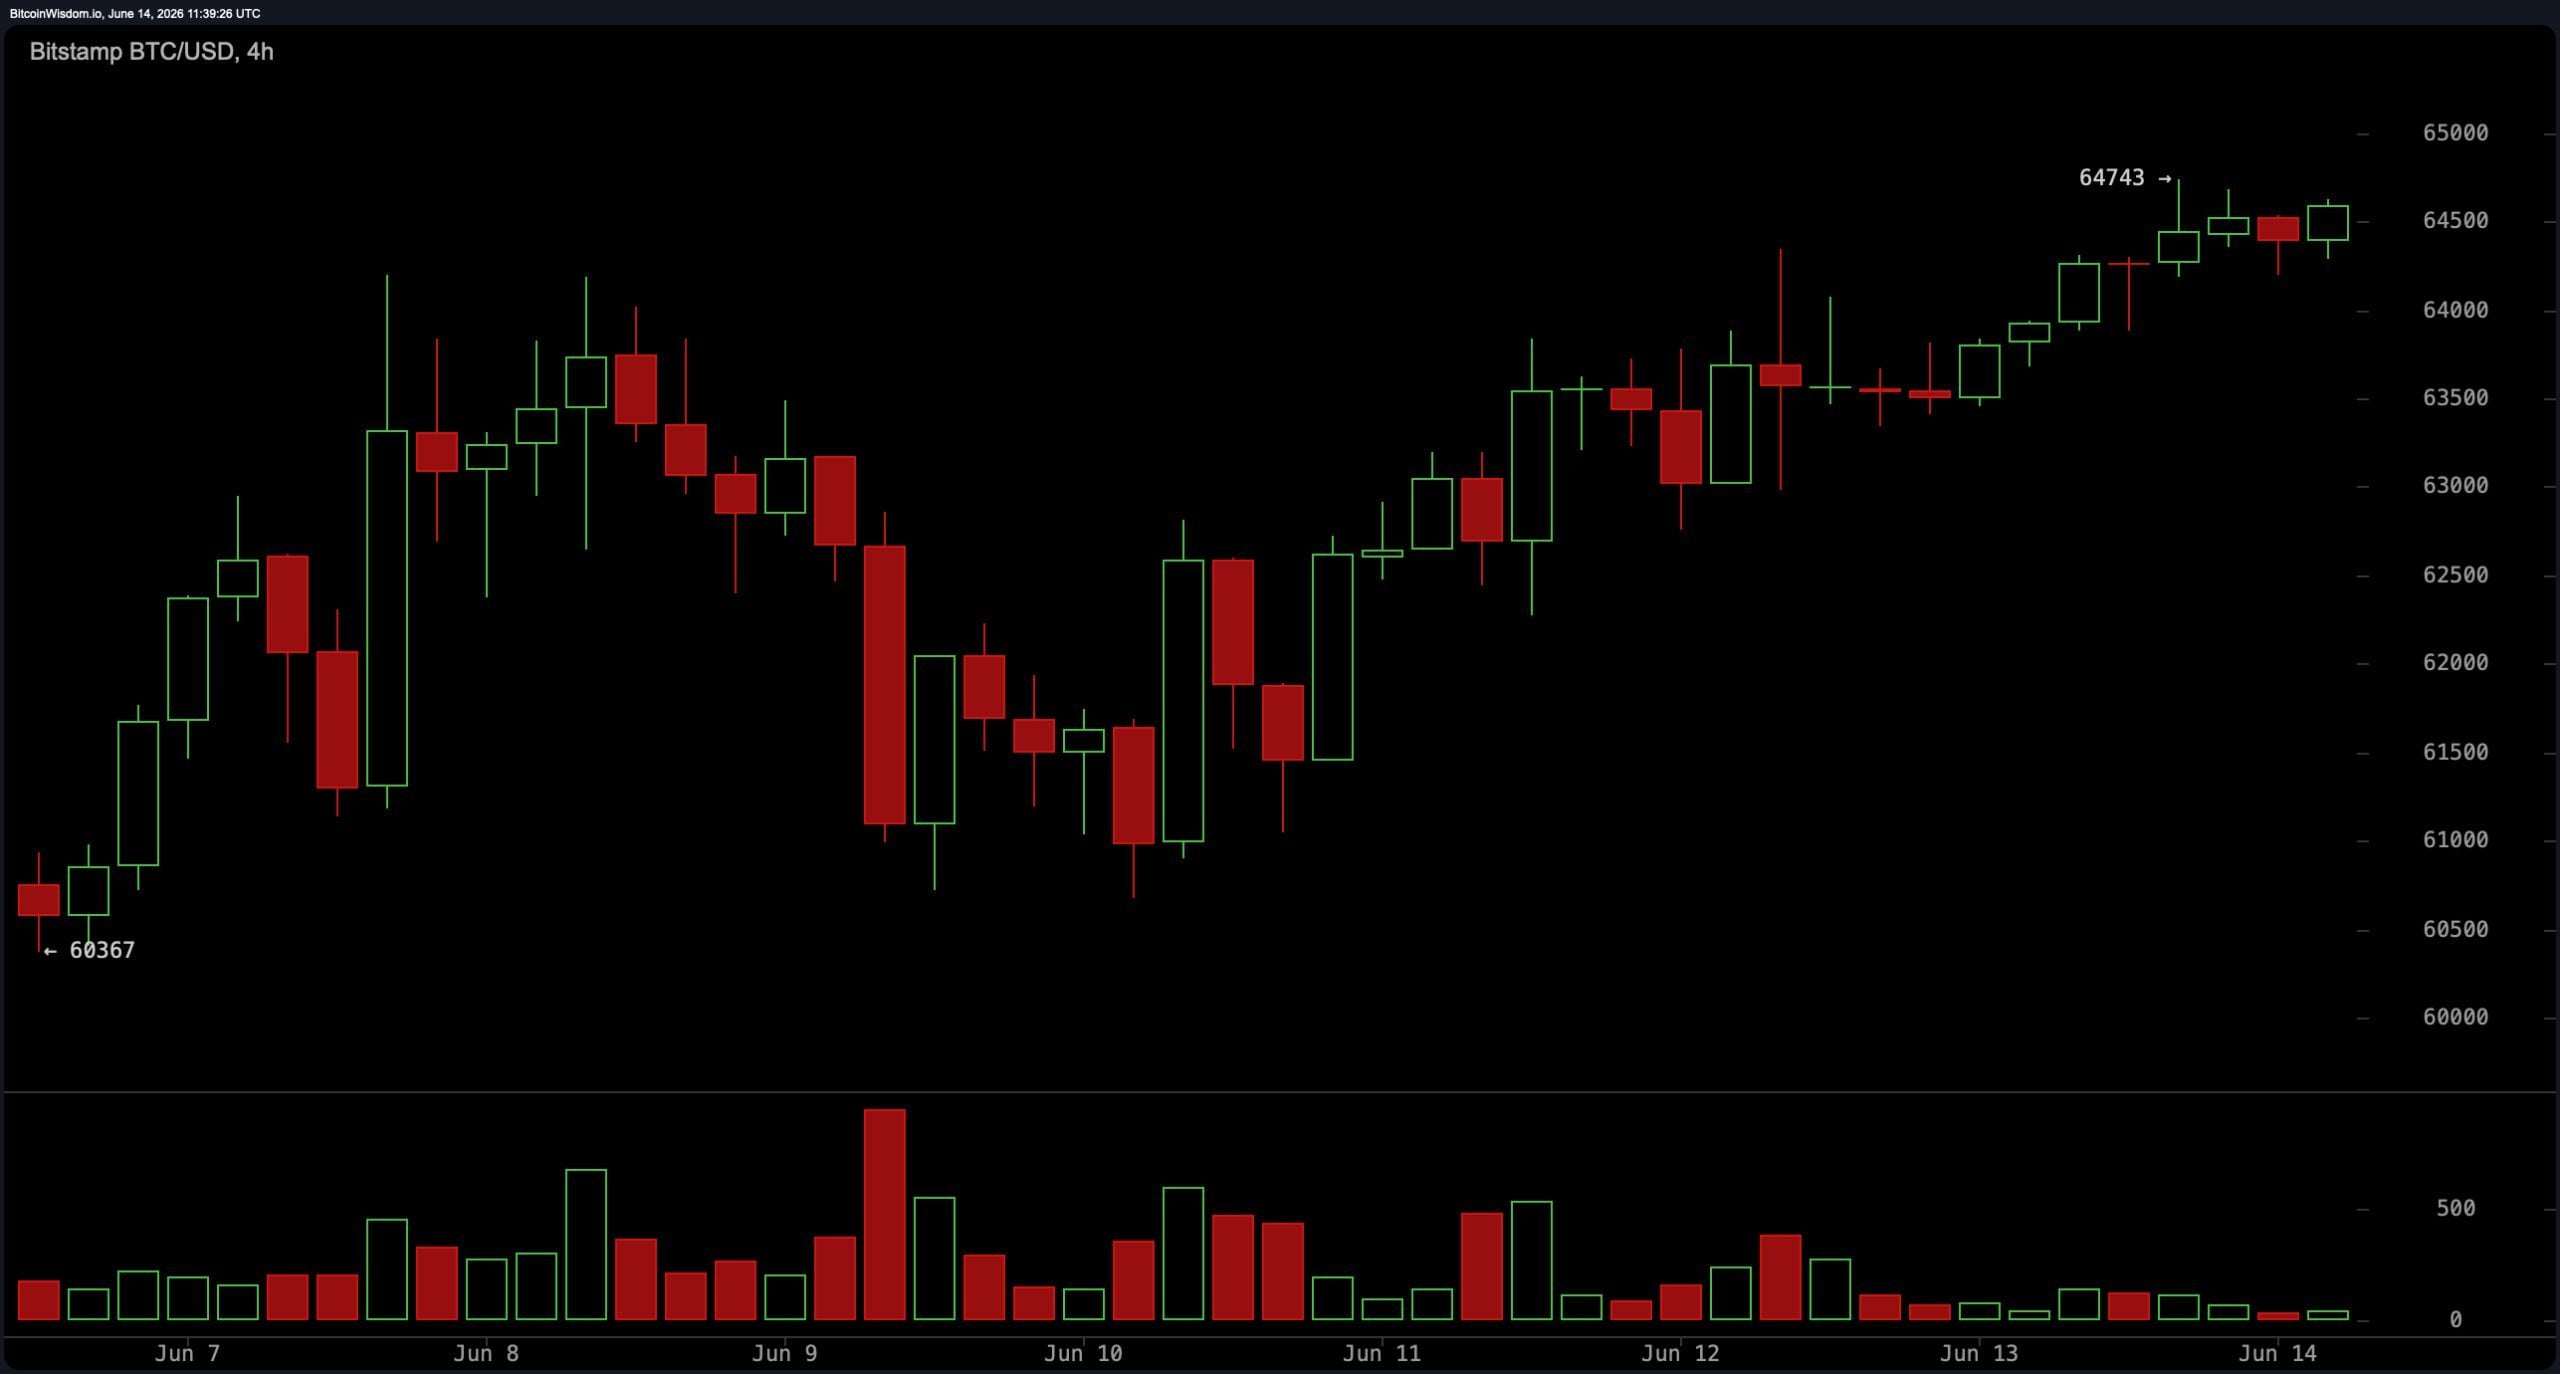
Price has recovered to the $62,000 to $64,000 zone, and the bias leans neutral to slightly positive for near-term relief. Key support sits between $61,500 and $62,700, while resistance clusters between $64,000 and $65,000. Pullbacks into the $62,000 to $62,700 range with volume confirmation are the golden ticket for traders eyeing a short-term bounce, with targets in the $64,500 to $65,500 area.
1-Hour Chart: Intraday Structure Favors the Brave (or Foolish)
The 1-hour chart is the most bullish of the bunch, like a puppy wagging its tail in a thunderstorm. BTC is attempting higher lows and showing bullish momentum after earlier oversold readings cleared. Intraday support has held around $62,700, while resistance sits in the $64,500 to $65,000 zone, right where the action is.
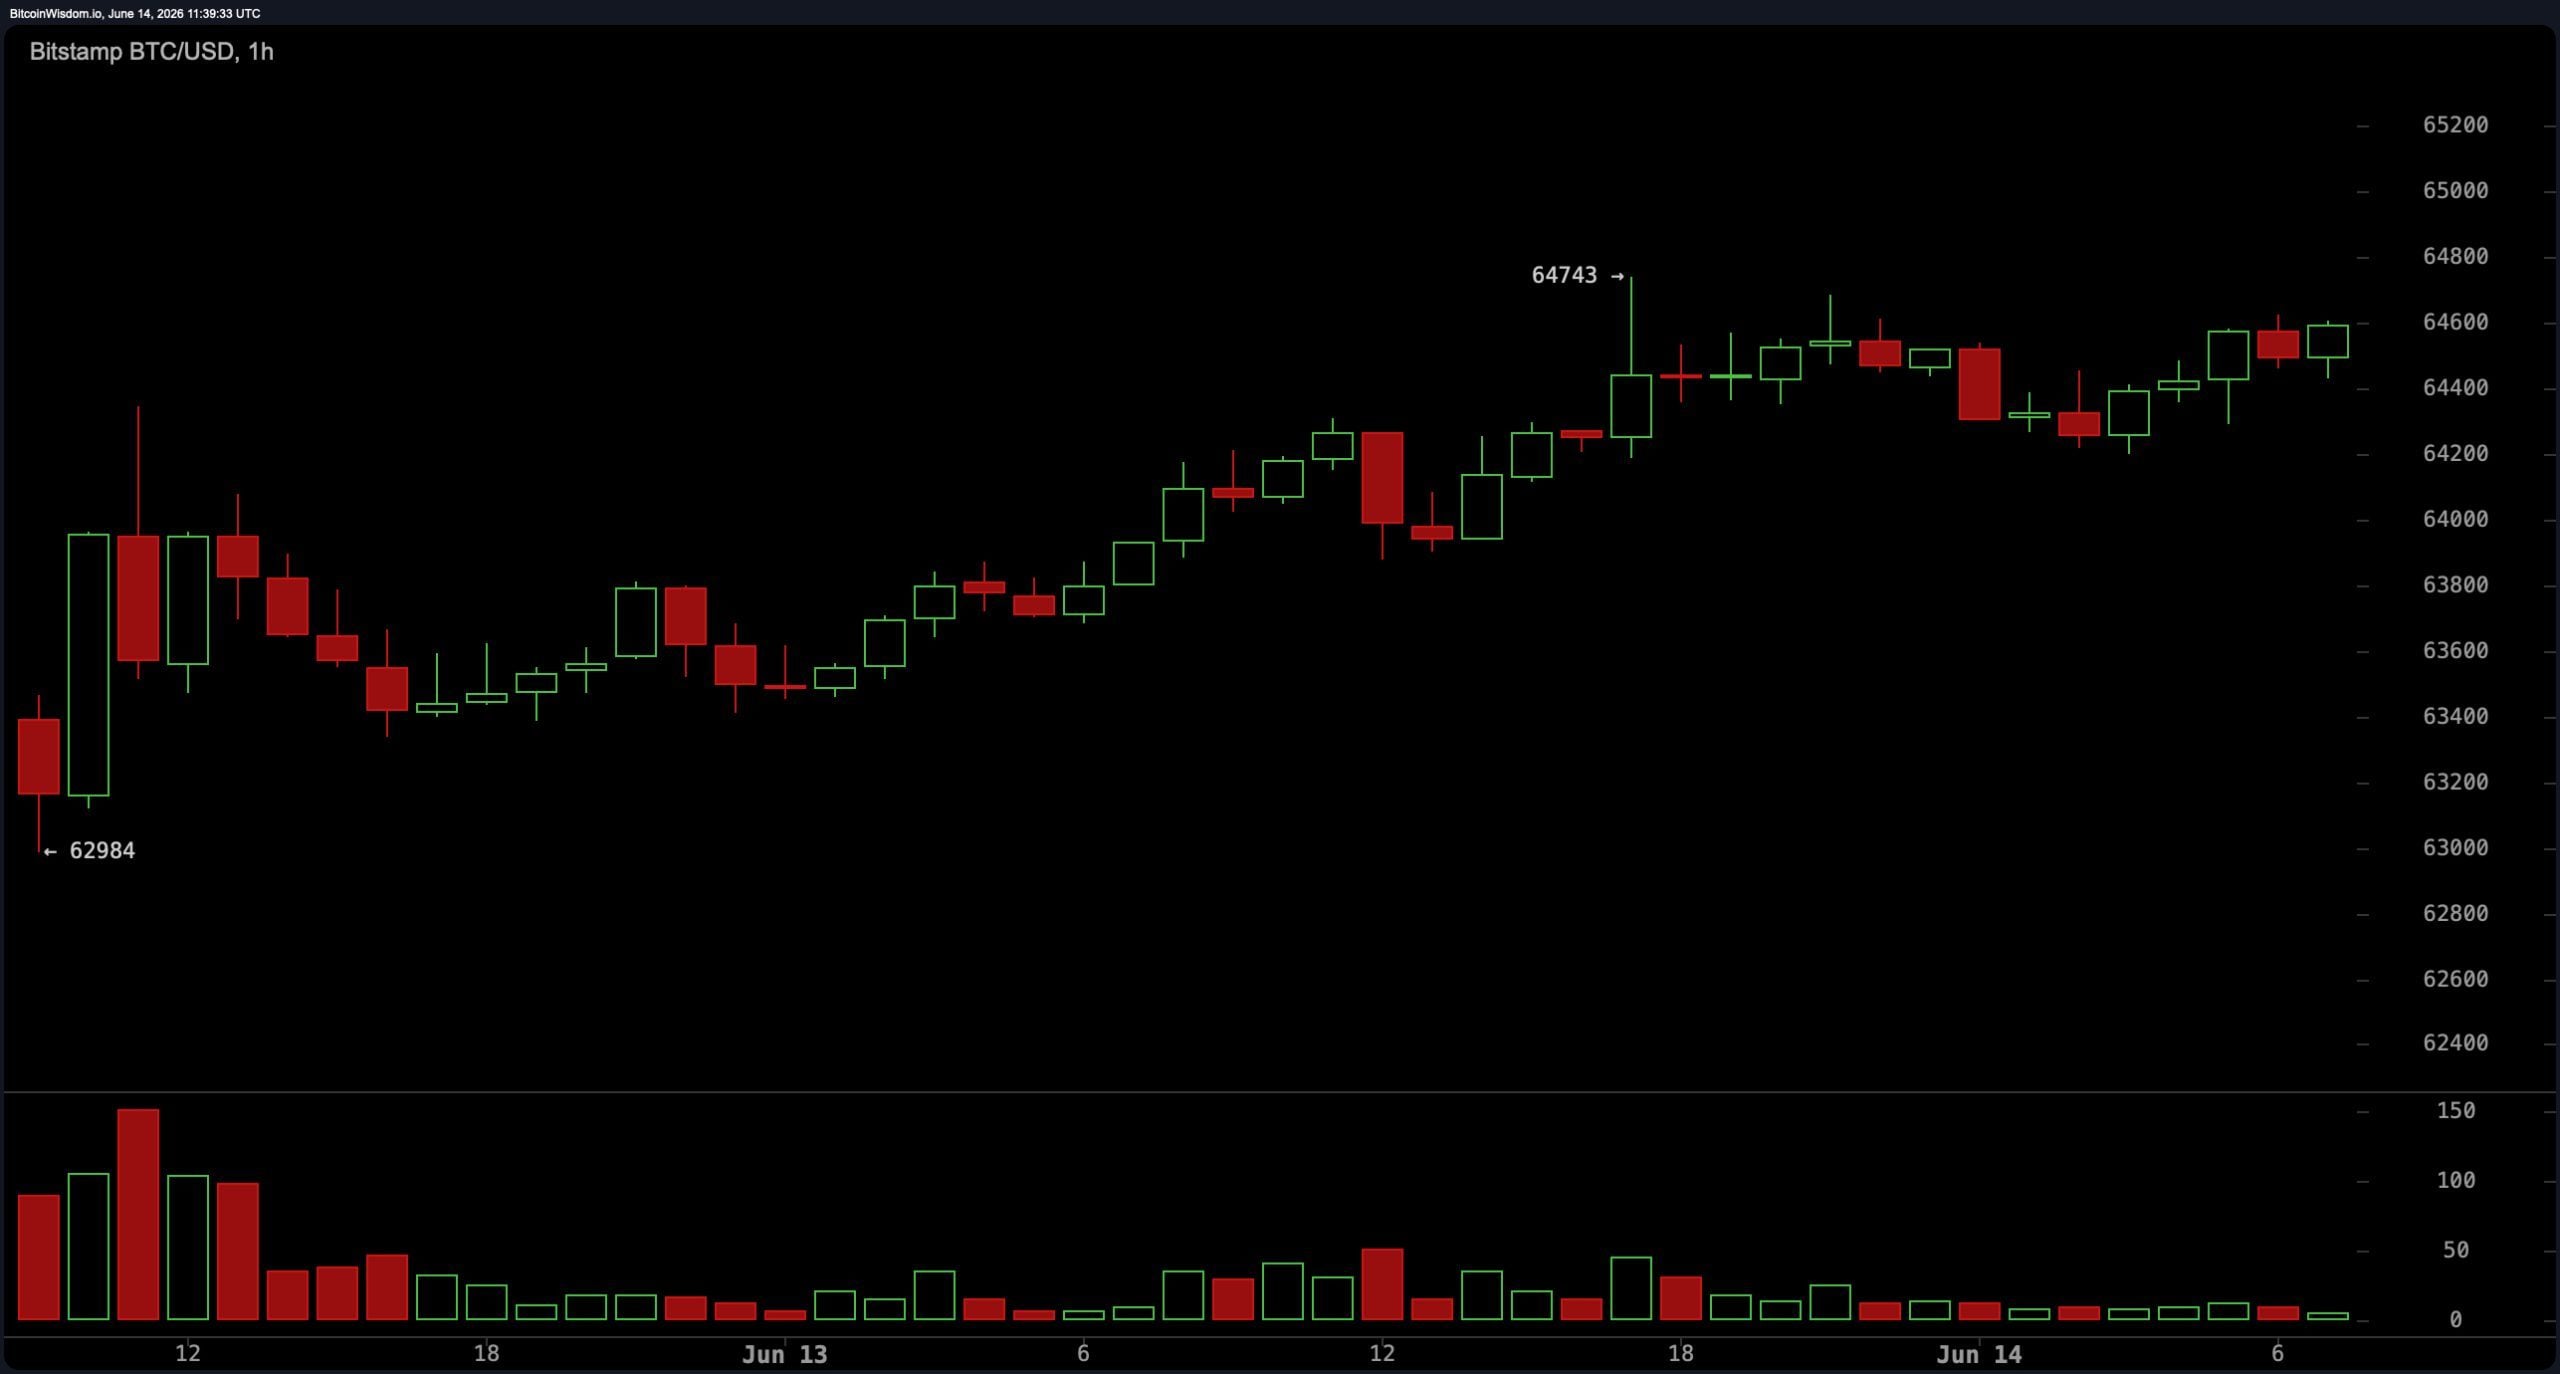
Lower-timeframe indicators, including the MACD’s positive signal, suggest continued intraday bounces. Traders are using dips to $62,700 to $63,000 as a reactive long zone, with scalp targets toward $64,800 to $65,500 and tight stops below $62,500 to avoid getting burned on failed setups.
Oscillators: Neutral With a Dash of Hope
zero negative signals, nine neutral readings, and two positive. Thrilling, I know.
Moving Averages: Bearish Pressure Dominates Longer Periods
Moving average data paints a bearish picture across longer timeframes, with 11 of 14 tracked averages waving red flags. The 10-period EMA sits at 64,200 and signals bullish, as does the 10-period SMA at 62,742. From the 20-period level out, every tracked moving average signals bearish. The 20-period EMA sits at 66,624, the 20-period SMA at 66,882, the 30-period EMA at 68,633, and the 30-period SMA at 70,274. Longer averages extend the gap further, with Bitcoin trading below each of them, confirming the bearish structure on the daily timeframe. A decisive close above $65,000 to $67,000 would start closing that gap against the nearest negatively signaling averages. Fingers crossed, eh?
Bull Verdict:
Bitcoin’s 1-hour and 4-hour charts are holding higher lows, the MACD and momentum indicator are both positive, and price is sitting on the 200-week SMA, a level that has historically absorbed heavy selling pressure. If buyers defend the $62,000 to $63,000 support zone and volume picks up, a push toward $65,000 to $67,000 is the next logical target. The oscillator panel carries zero negative readings, so downside confirmation is absent for now. Hooray?
Bear Verdict:
Eleven of 14 moving averages are negative, price remains well below the 200-period EMA at $78,792, and the daily chart has not produced a confirmed trend reversal. The rebound from $59,100 looks corrective rather than impulsive, and the $64,500 to $65,000 resistance zone has not been cleared with conviction. A failure to hold $62,000 reopens the path toward the $59,000 to $61,000 demand area, and a daily close below $59,000 puts the $50,000 zone back on the table. Brace yourselves.
Read More
- Gold Rate Forecast
- CNY JPY PREDICTION
- USD MXN PREDICTION
- CNY RUB PREDICTION
- Silver Rate Forecast
- Brent Oil Forecast
- Senate’s CLARITY Act: A July 4th Fireworks Display or Political Fire Sale?
- USD PHP PREDICTION
- LAB PREDICTION. LAB cryptocurrency
- USD CNY PREDICTION
2026-06-14 15:57