The cryptocurrency market is currently stable, with Bitcoin and Ethereum prices remaining in a narrow range for over a month and a half. Recent activity in the derivatives market, starting in mid-March, is now offering the first clear signals about potential future price movements.
Recent analysis from CryptoQuant shows a significant increase in activity for Bitcoin and Ethereum perpetual futures. On March 16th, the total open interest (OI) for both cryptocurrencies reached around $30 billion – the highest level since late January. This surge happened quickly, all within a single week of focused trading. Bitcoin’s open interest hit $23 billion, and Ethereum reached nearly $16 billion. Notably, both cryptocurrencies experienced this increase simultaneously, coinciding with a price increase.

When you see a sudden increase in trading activity for both Bitcoin and Ethereum during a price recovery, it’s likely not people actually buying the cryptocurrencies. Instead, it suggests traders are making leveraged bets, hoping to profit from a predicted price swing. The money isn’t going into the assets themselves; it’s being used to gamble on their future price.
After fifty days of sideways trading, tension is building in the market. The $30 billion currently held in perpetual futures contracts suggests traders don’t believe the current price range will continue indefinitely, and when it finally breaks, the resulting price movement is likely to be significant.
When Crypto Leverage Moves, It Goes to Binance First.
A recent CryptoQuant report details the location of $30 billion in open interest. Binance saw the biggest increase, with Bitcoin open interest rising by $829 million and Ethereum by about $1.6 billion – a total of $2.4 billion in new leveraged positions within a week. While Bybit and Gate.io also experienced gains, the data clearly shows Binance as the dominant exchange.

This isn’t a random occurrence; it’s how the market works. When prices are rising quickly, money doesn’t spread out evenly among different trading platforms. Instead, it flows to the biggest, most active platforms where traders can easily buy and sell large amounts without affecting the price. Binance is currently that platform. It’s consistently been the go-to place for growth in the derivatives market, and the recent price increase in March was no different.
Understanding *where* money is concentrated is just as crucial as the total amount. A large influx of new investment, like the $2.4 billion seen on one exchange recently, leads to similar trades being heavily grouped together. This grouping creates specific price points where many positions could be closed out, or ‘liquidated.’ Consequently, if the market moves against these concentrated positions, the price change won’t be smooth – it’s likely to be sudden and impactful.
The leverage is on Binance. The range is still intact. Those two facts belong in the same sentence.
The Entire Market Has Given Back a Year of Gains
The total value of all cryptocurrencies is currently $2.31 trillion, a slight decrease of 0.21% over the past week. The market started the week at $2.32 trillion, briefly rose to $2.44 trillion, but then fell back down. The fact that the price couldn’t sustain the rise to $2.44 trillion is the most important takeaway – the market tried to recover but faced resistance.
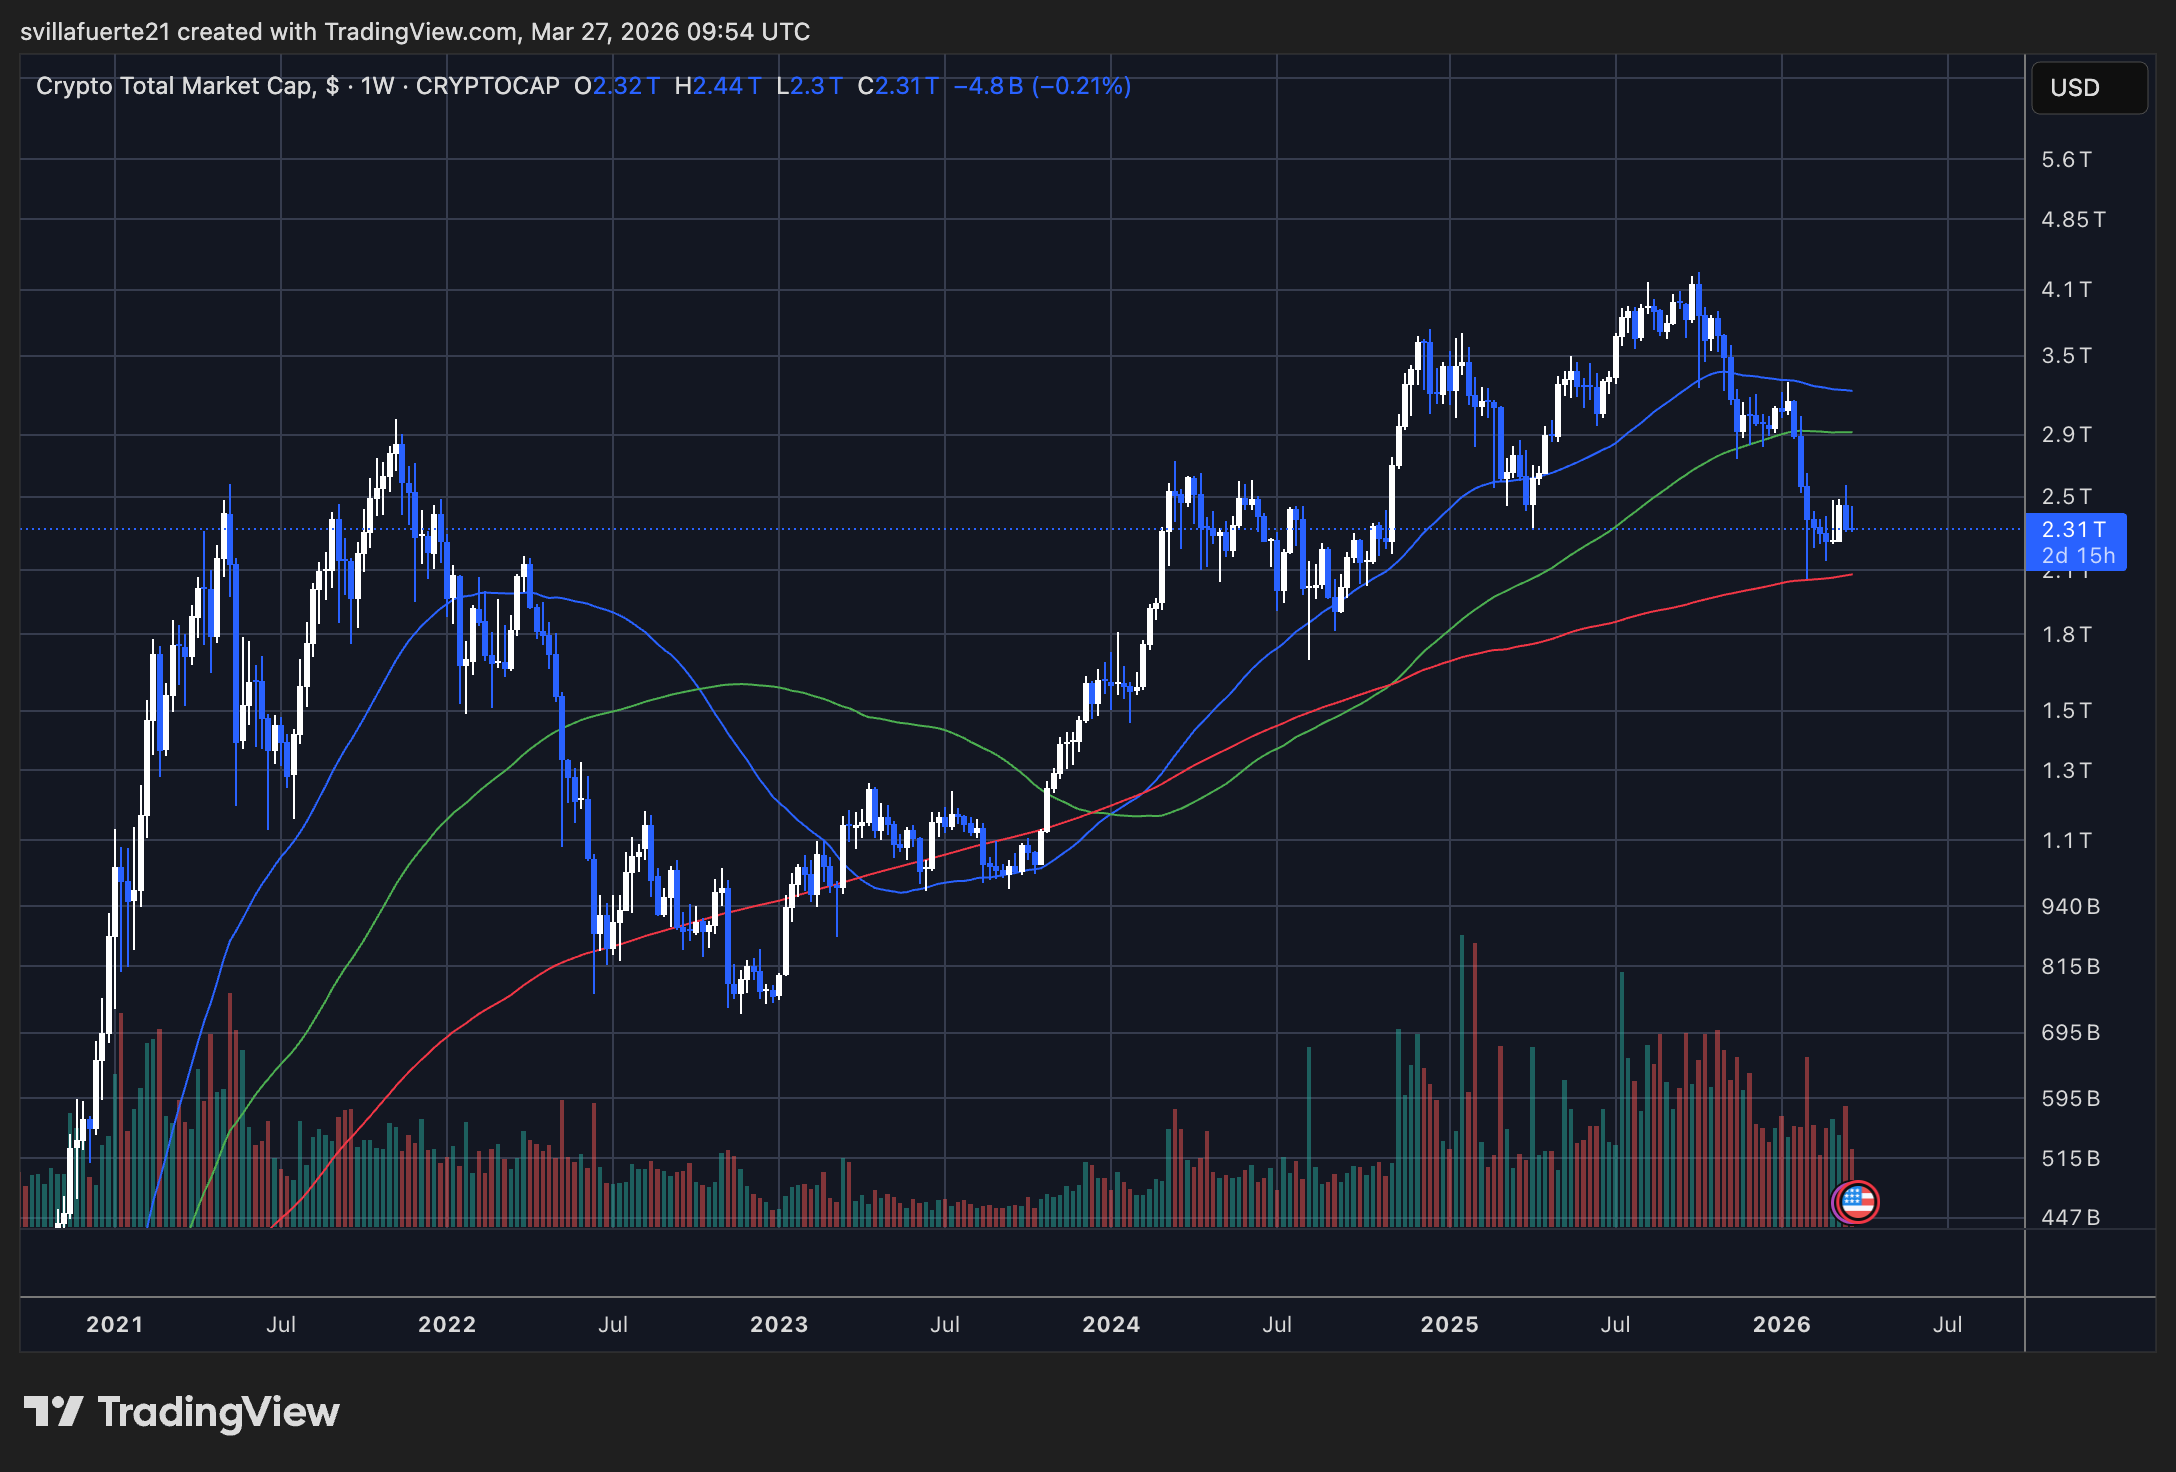
Looking at the bigger picture, the current situation is quite concerning. We saw the total crypto market cap hit a record high of around $4.1 trillion in late 2025, but it’s since fallen about 44% from that peak. This decline has wiped out all the gains from the 2025 bull run, bringing us back to price levels we saw in early 2024. I don’t see this as just a temporary dip within a larger upward trend; it feels like a complete market cycle has turned.
Technical indicators confirm significant damage to the price structure. The price has clearly fallen below the 50-week moving average, which is now trending downward from around $3.5 trillion. The 100-week moving average, currently around $2.9 trillion, offered no support, and the price has remained below it since breaking through. The 200-week moving average, continuing to rise near $2.1 trillion, now represents the last major support level on this chart.
As I’m looking at the market, we’re currently at $2.31 trillion, caught between key moving averages – the 200-week average below acting as support, and the 100-week average above as resistance. This area is where the market is really fighting it out. To confidently say we’re seeing a real recovery, we need to get back above $2.9 trillion. Right now, the price action suggests we’re in a downtrend, not just pausing before the next move.
Read More
- ETH PREDICTION. ETH cryptocurrency
- Why Best Wallet Token is Your New Favorite Crypto Wallet – Young, Hip, and Ready to Disrupt!
- UMA’s Oracle Update: Now Only the Chosen Few Can Propose Market Resolutions 🚀🔒
- 🚀 Doge to the Moon? 2,000% Surge or Just a Shaggy Dog Story? 🐶💰
- BTC PREDICTION. BTC cryptocurrency
- Maxim Gorky’s Take on the $5T Stablecoin Tsunami and the $BEST Token
- Silver Rate Forecast
- Brent Oil Forecast
- XMR PREDICTION. XMR cryptocurrency
- Binance and BBVA: A Match Made in Crypto Heaven 🤑
2026-03-27 21:41