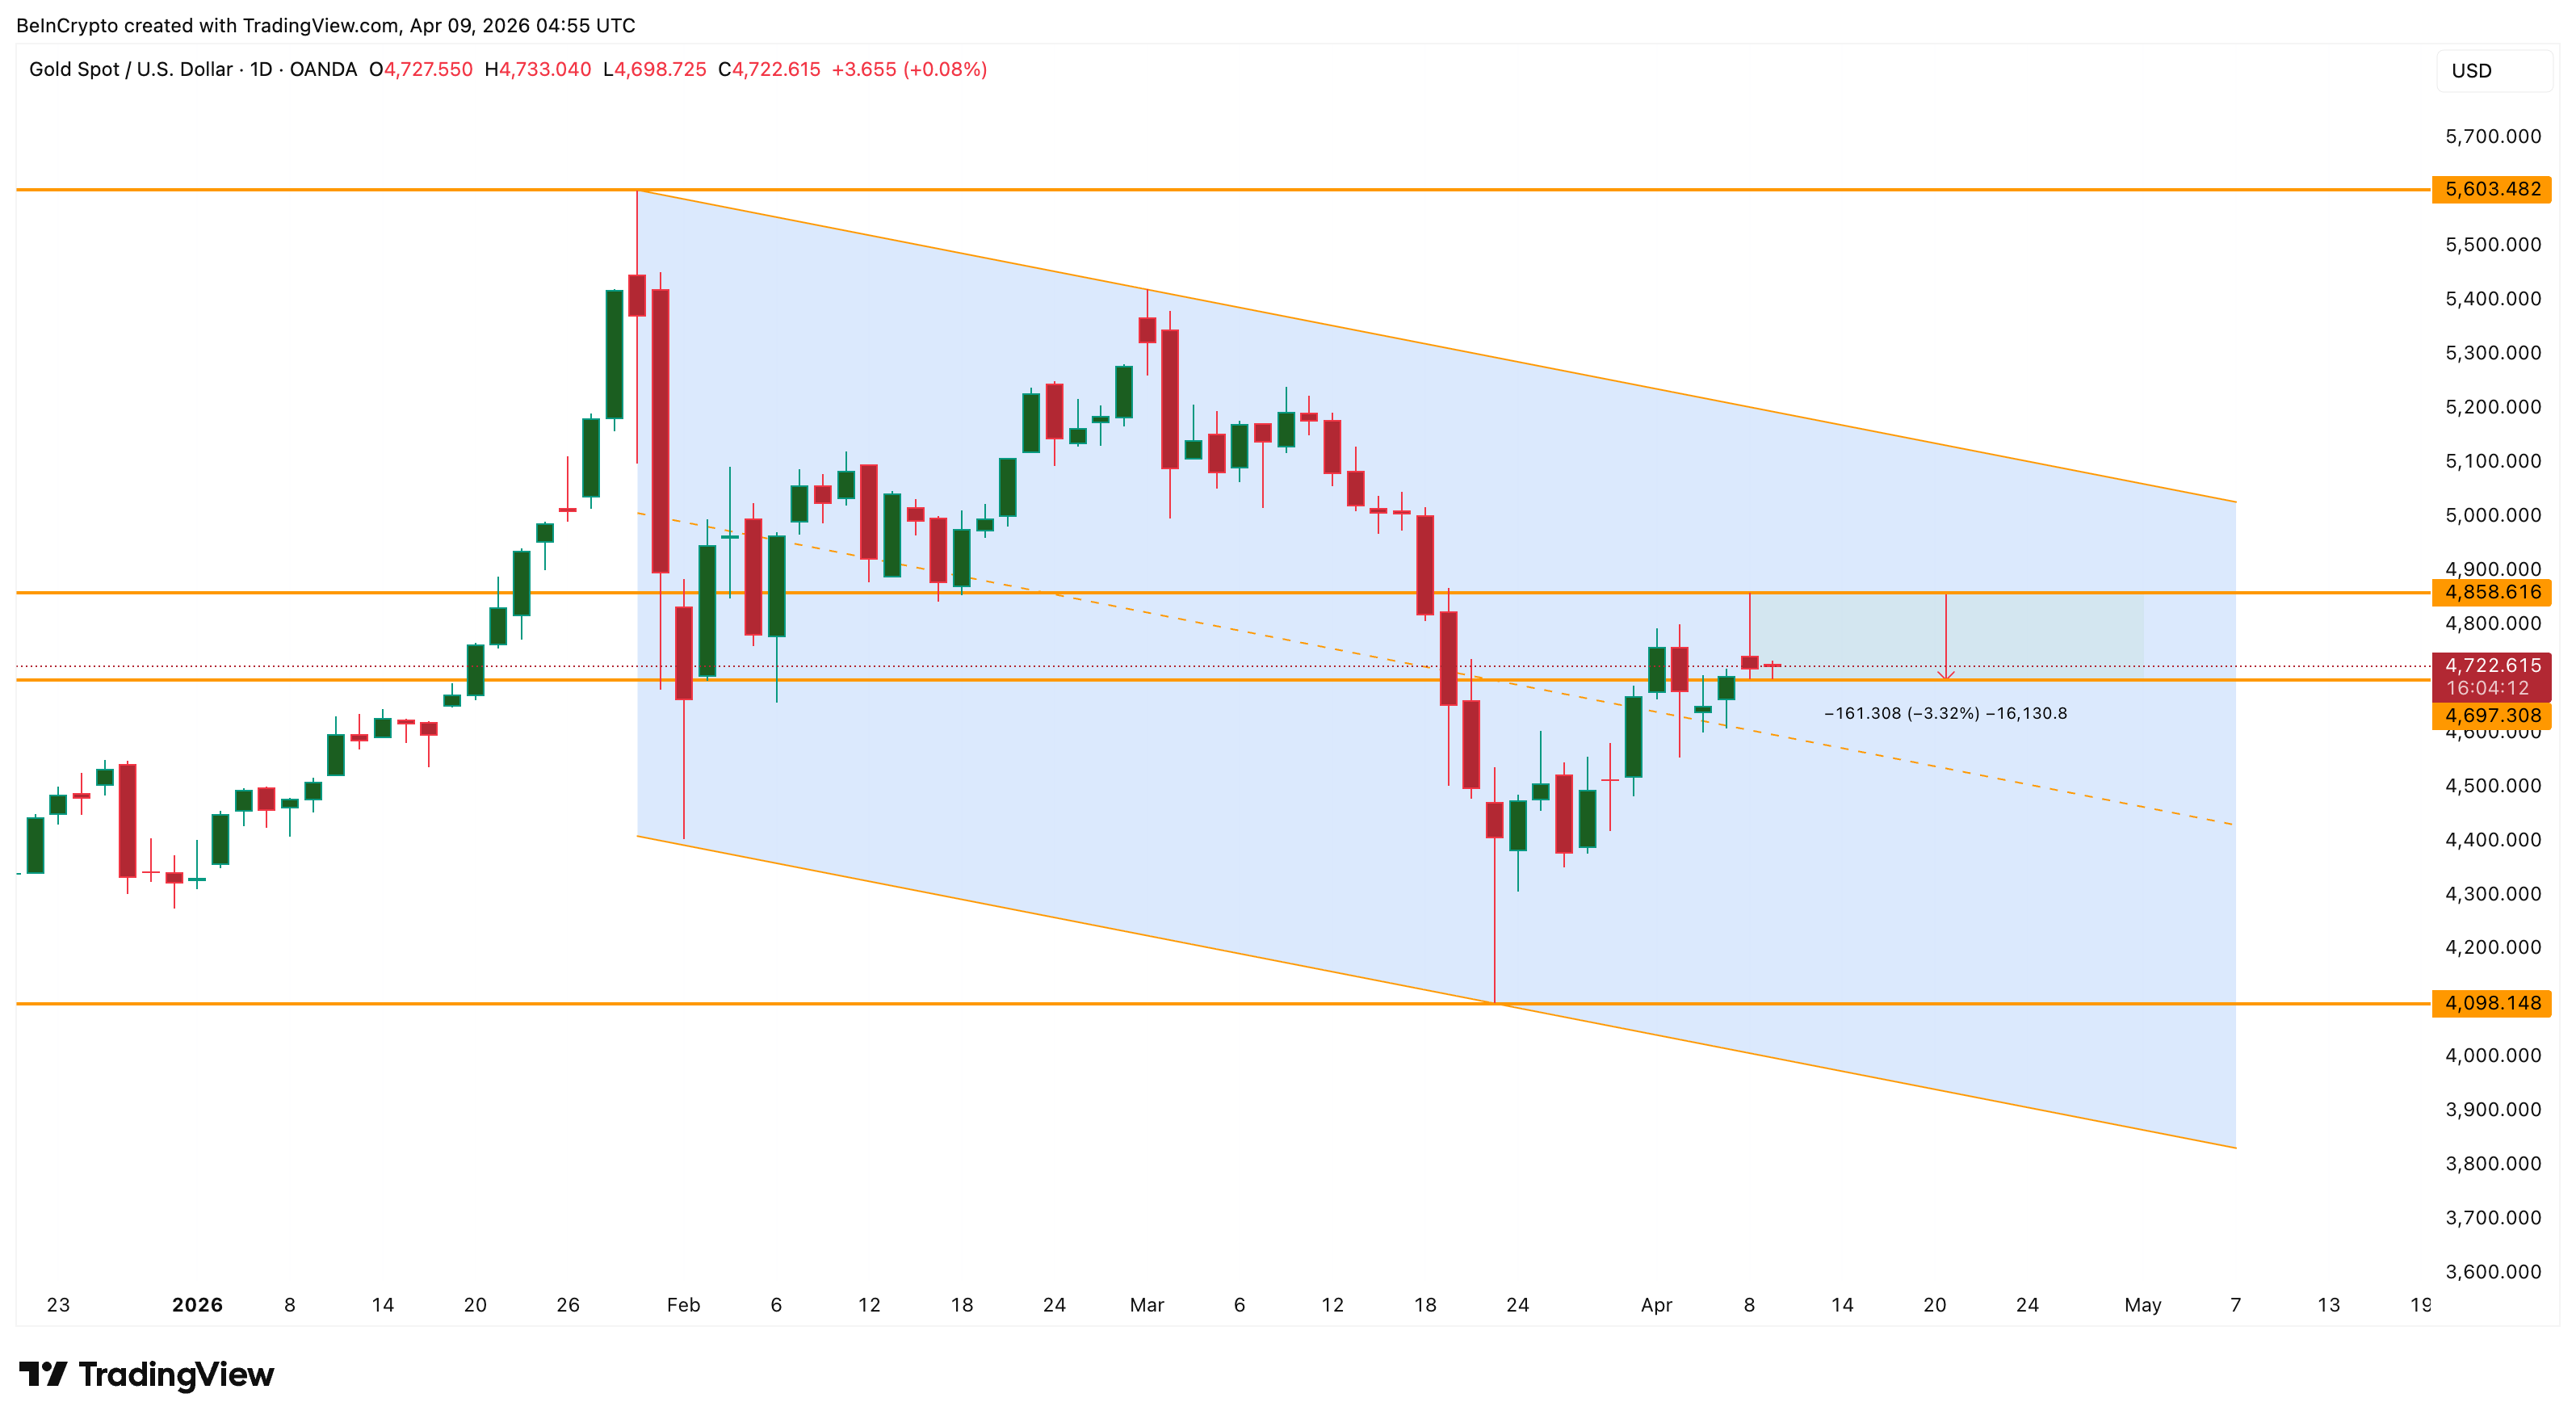
Gold (XAU/USD) is currently prancing at $4,722 on April 9, taking a rather fashionable tumble of 3.32% from its high on April 8, which was a snazzy $4,858. All thanks to a dollar that decided it wanted to have a little rebound party.
This slip-and-slide came right after the US Dollar Index (DXY) bounced up 0.65% from a modest low of $98.52. It seems the good old petrodollar, that trusty old friend, decided to come back into the picture, lending strength to the dollar as oil prices did their little waltz back up. However, fear not, dear reader! There are still some cheeky bullish signals lurking beneath this temporary setback, keeping the $5,000 dream alive. A bullish divergence, an eager 20-day EMA (Exponential Moving Average), and a rather cheeky gold-silver ratio are all hinting that the path to $5,000 remains as intact as your grandmother’s china collection.
Gold’s Falling Channel Vs. Dollar’s Ascending Channel
Gold, poor thing, has been wallowing in a falling channel on the daily chart since it hit a high of $5,603 on January 29. It went on a bit of a downer after that, with its most recent pit stop at $4,098 on March 23. A brief rally followed, pushing gold up to $4,858 on April 8, but, alas, the dollar had to intervene with its usual strength. Typical.
But wait, the DXY has been living it up inside an ascending channel throughout most of 2026. When the April 7 ceasefire announcement made its grand entrance, the DXY did a little jig down to $98.52, almost kissing the lower trendline. But then, just as it seemed the dollar might faint, a few cheeky violations of the truce and some tension in the Strait of Hormuz made oil bounce back up. And with that, the dollar had its moment of glory, bouncing 0.65% to $99.01.
The dollar and gold have been playing this lovely inverse tango for some time. When the dollar weakens, gold struts its stuff, and when the dollar perks up, gold takes a breather. This 3.32% drop between April 8-9? Oh yes, it’s all thanks to the dollar getting its second wind. If gold has any hopes of climbing higher, that pesky DXY needs to dip below $98.52. Until then, the dollar is the ceiling, and gold is still staring up at it, yearning.
Now, the dollar headwind? Real, yes. But fleeting, my dear friends. There are two sneaky little signals on the chart that suggest the party isn’t over for gold just yet.
RSI Divergence and EMA Signal Build the Bullish Case
Between February 2 and April 2, gold made a higher low, while the Relative Strength Index (RSI) – that charming little momentum indicator – made a lower low. This, dear reader, is known as a hidden bullish divergence. It’s a fancy way of saying gold could still be gearing up for a little more action, even though it’s been momentarily halted. As long as gold doesn’t dip below its latest swing low of $4,557, this bullish signal is still flashing its green light.
The EMA, the ever-reliable trend indicator that loves giving more weight to recent movements, is also on gold’s side. The 20-day EMA sits at $4,721, practically where gold is now. The 50-day EMA is a smidge higher at $4,780. During the rally from March 23, gold managed to glide above the 100-day EMA at $4,633, and it’s stayed above that line like a well-behaved student.
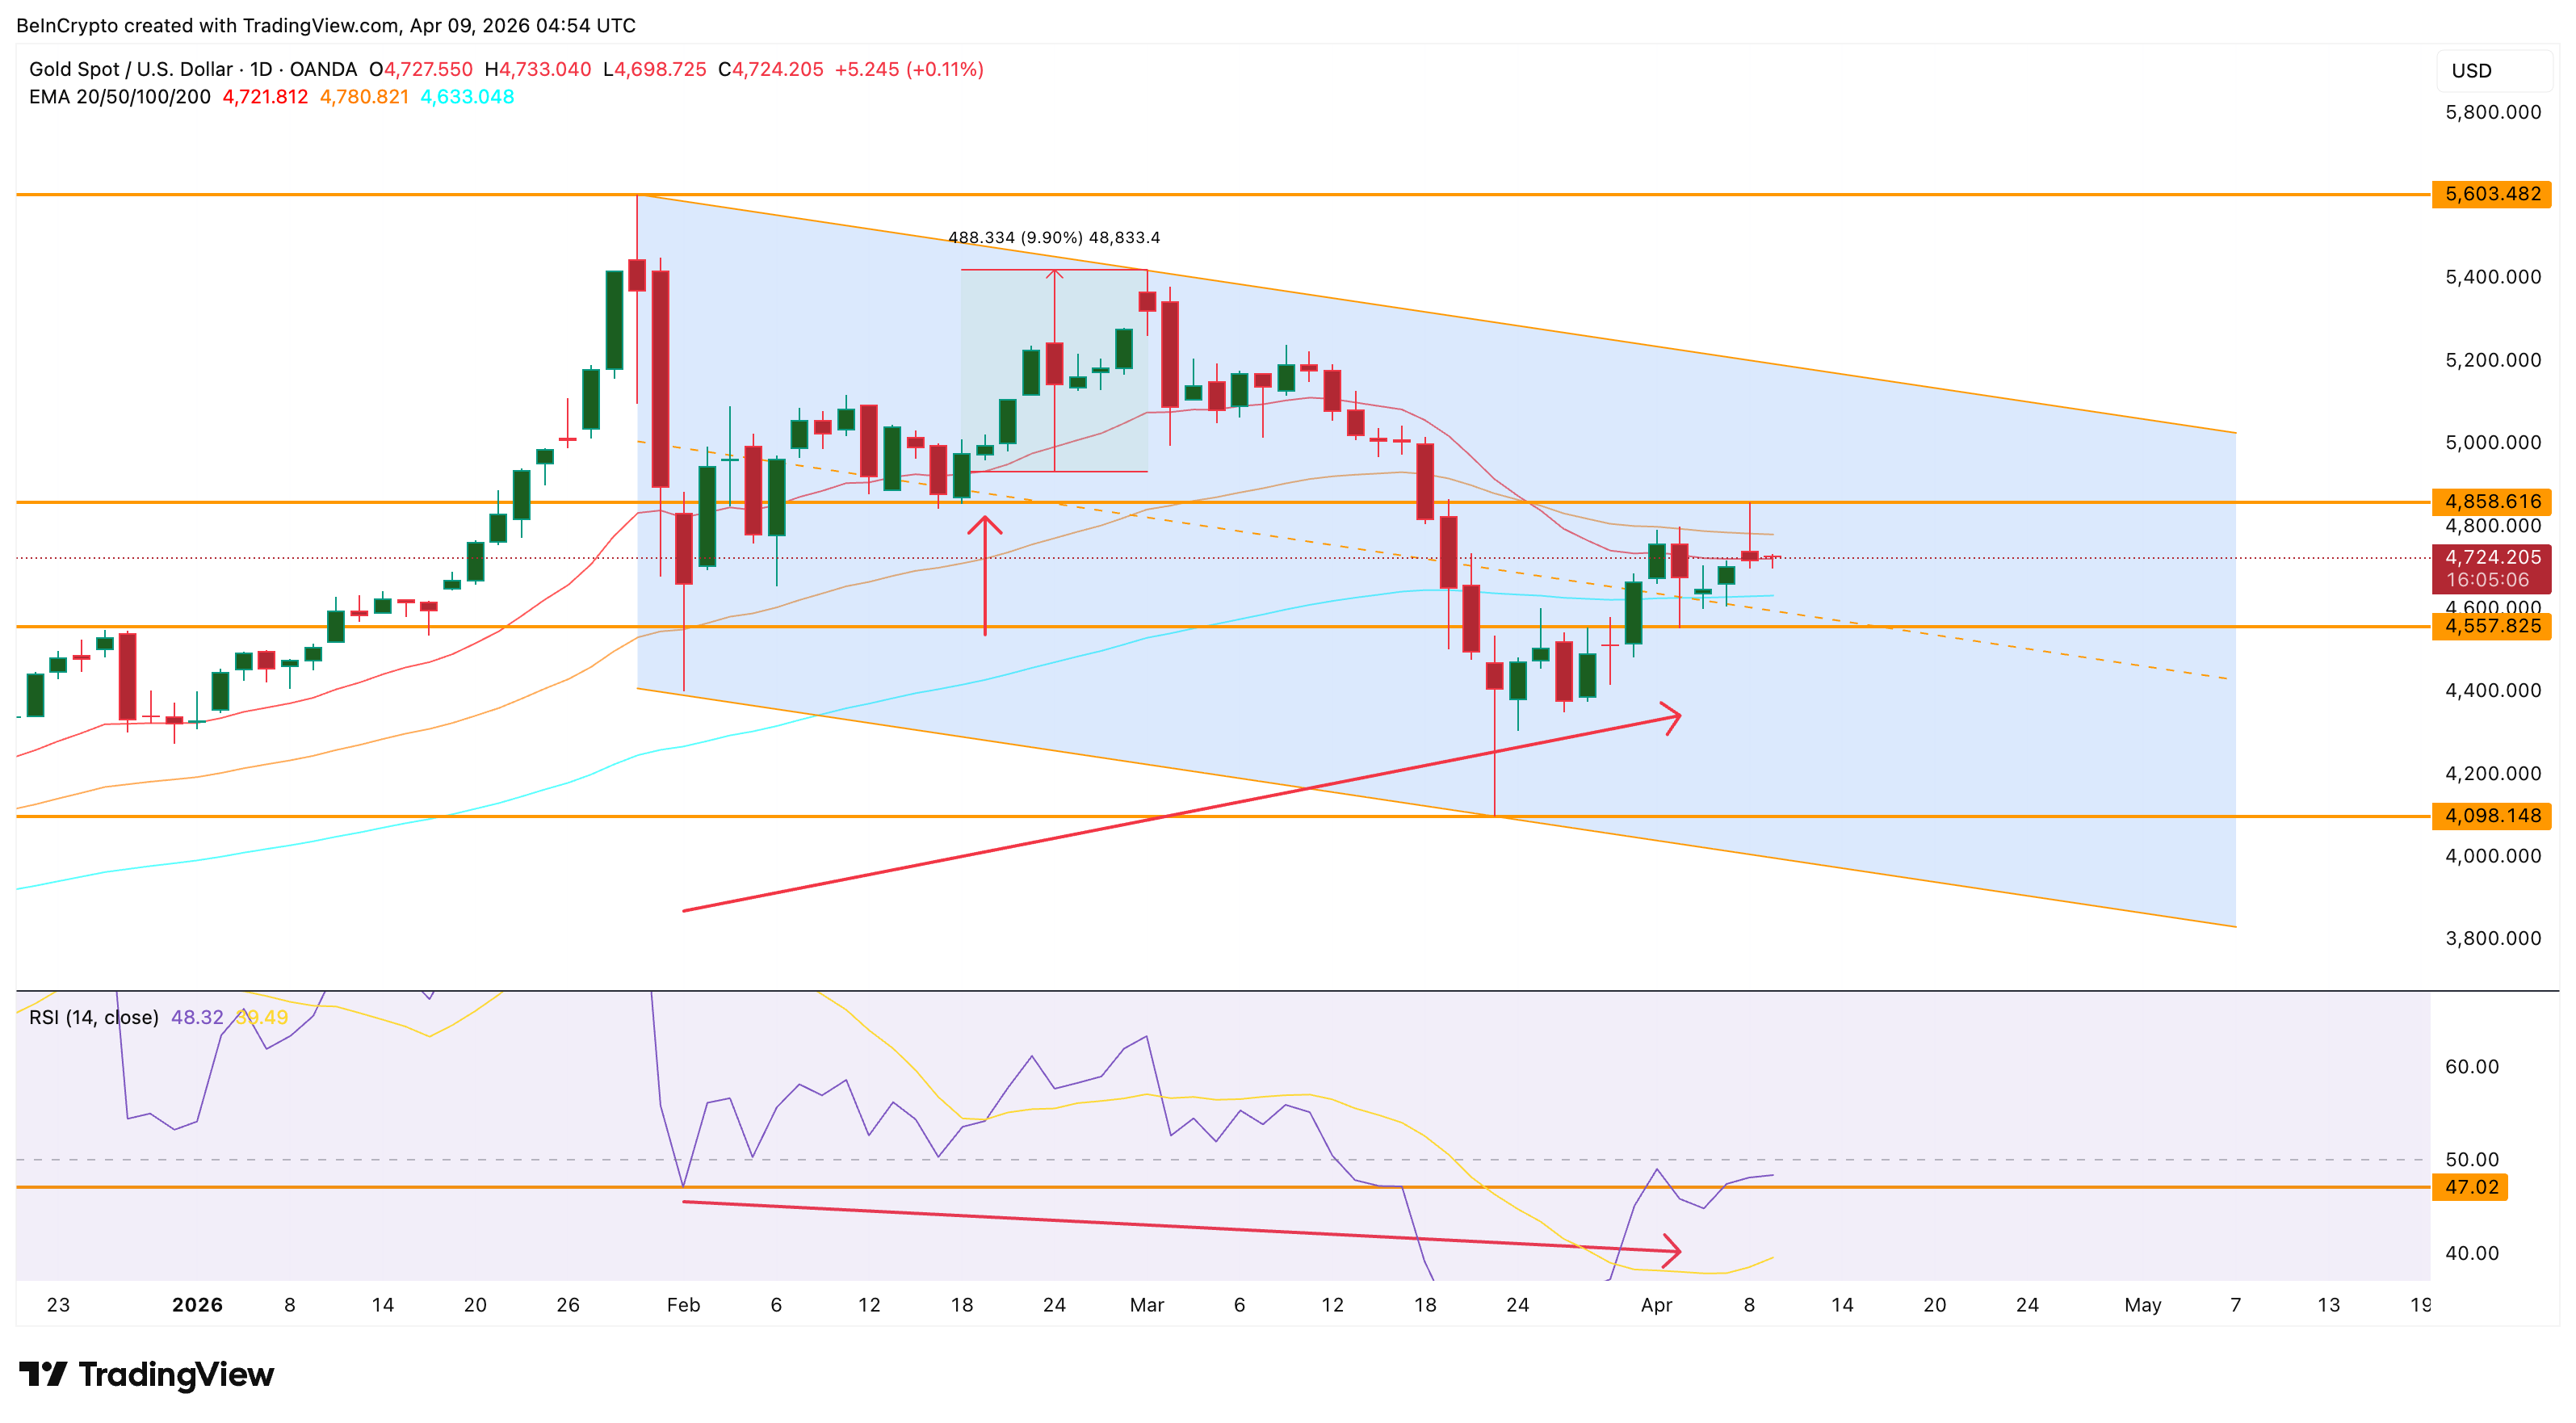
The last time gold reclaimed the 20-day EMA was February 18, and that little jaunt led to about a 10% gain. If gold does it again, we could be looking at another, albeit slightly more dignified, move.
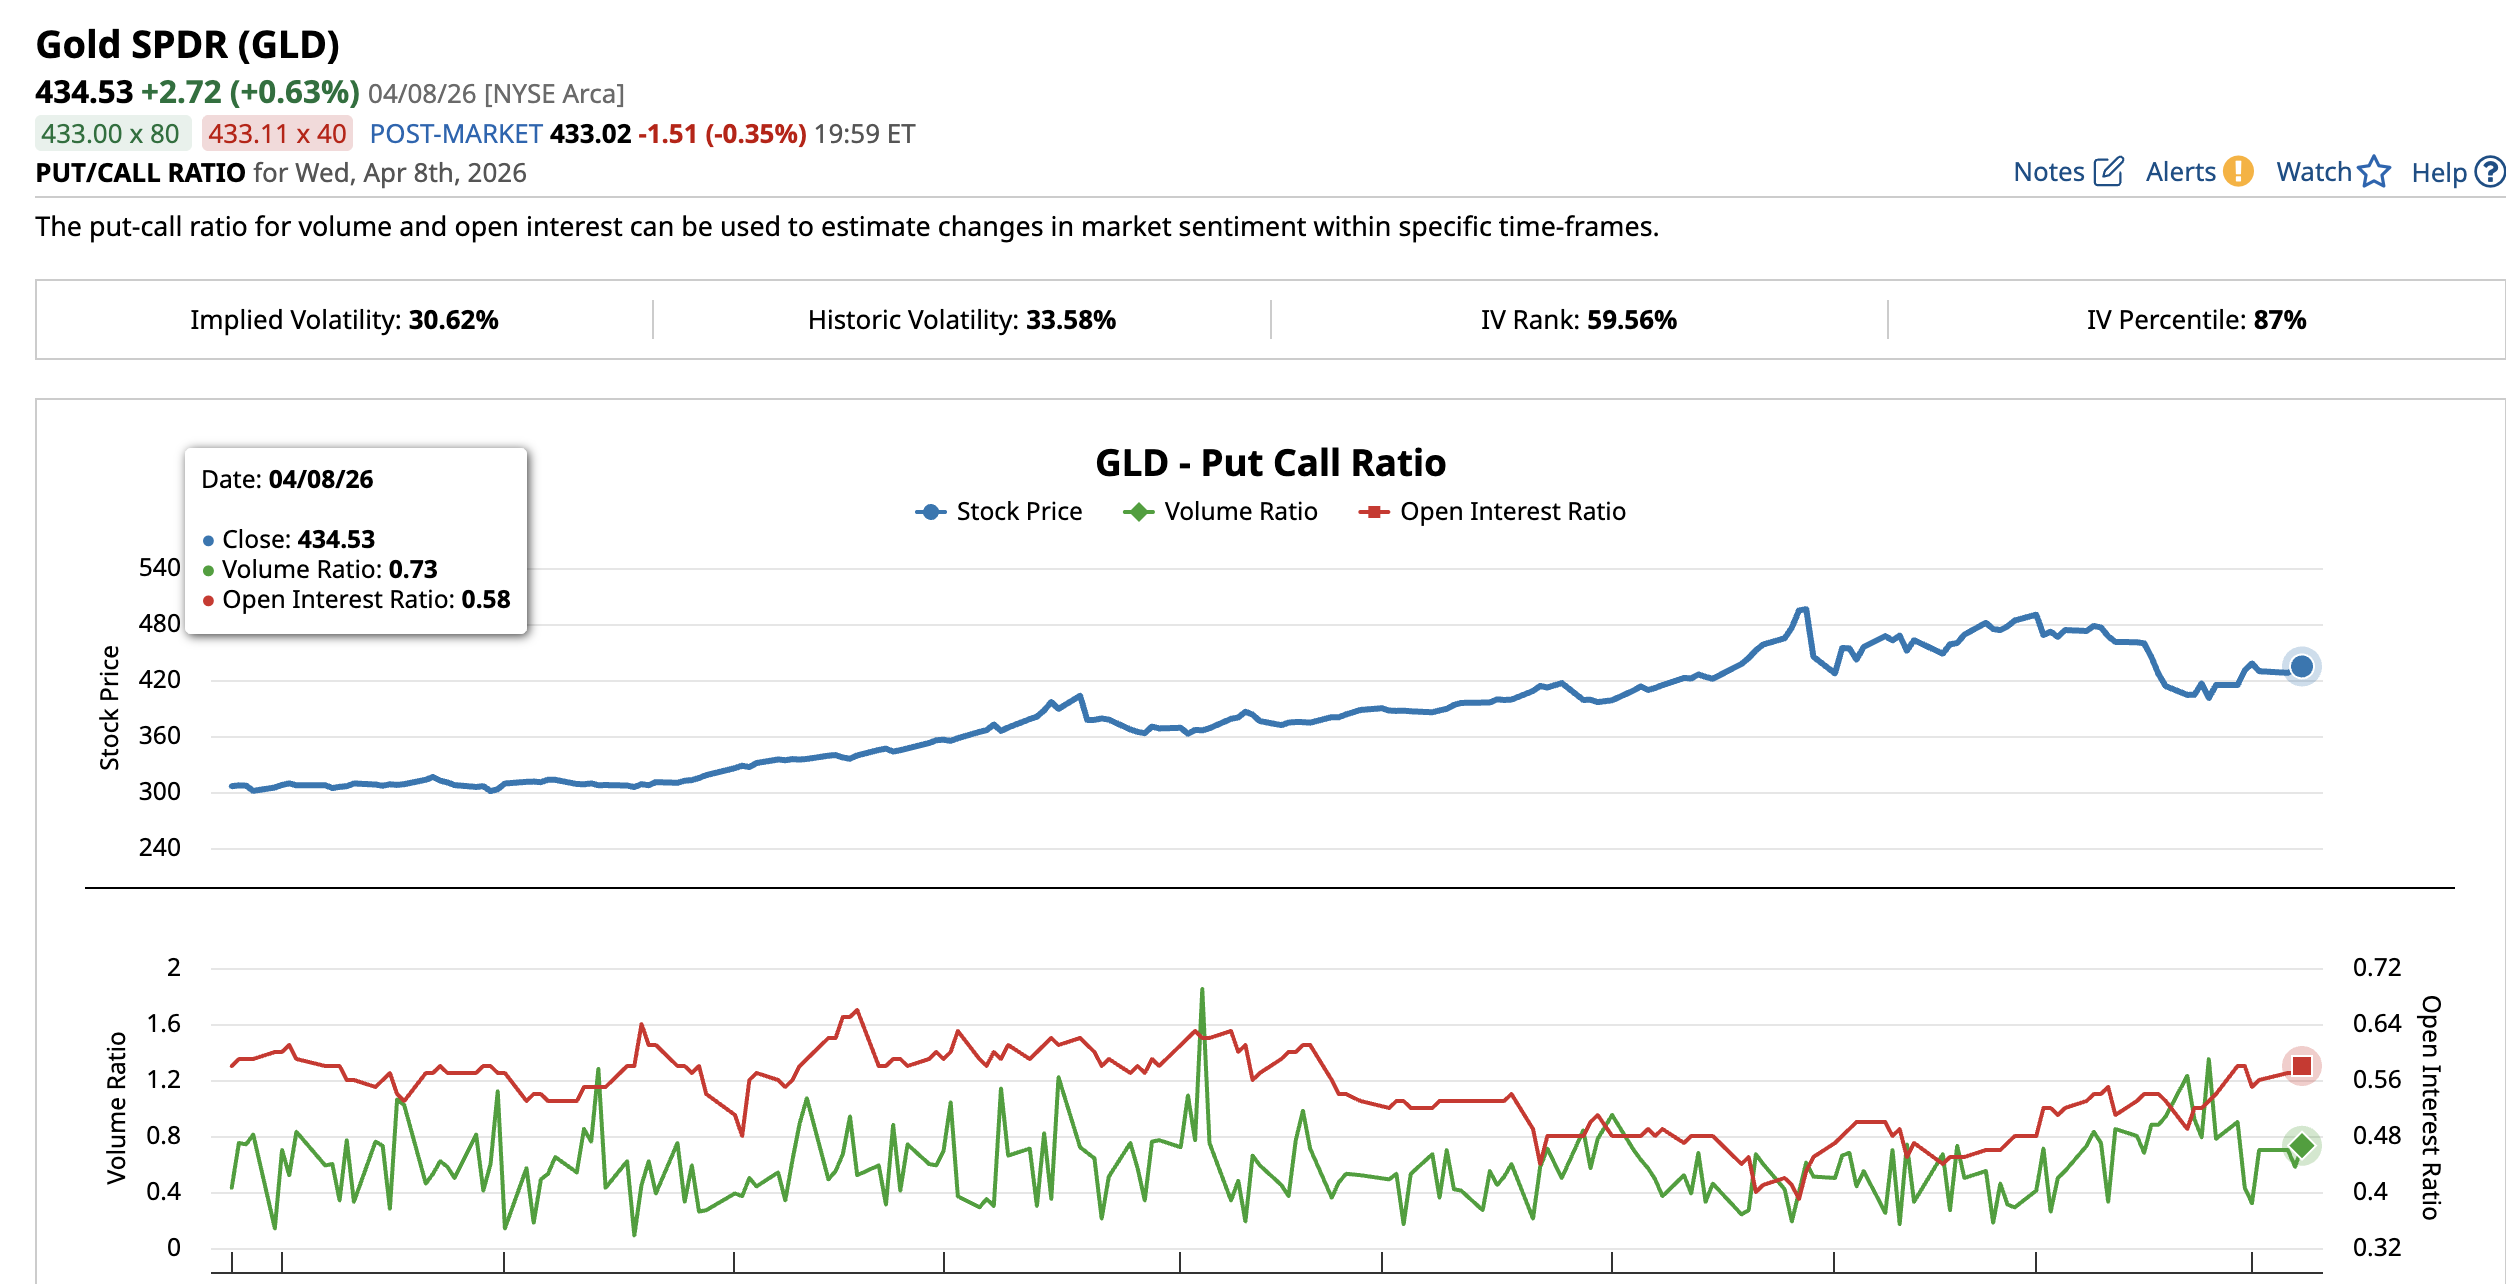
Now, the SPDR Gold Shares (GLD) put-call ratio – that’s just a fancy term for measuring sentiment on the largest gold-backed ETF – is showing mild hedging activity, not full-on panic. The volume ratio moved from 0.58 on April 7 to 0.73 on April 8. The open interest ratio climbed from 0.57 to 0.58. All this means is that traders are adding a little protective padding, not exactly jumping off the gold ship.
So, the RSI divergence and EMA reclaim signals are leaning in favor of the bulls. But gold’s ability to outshine everyone else – particularly silver – depends on the gold-silver ratio, which is currently forming a rather tidy inverse head-and-shoulders pattern.
Gold-Silver Ratio Builds Bullish Structure as Gold Eyes Outperformance
The gold-silver ratio (XAU/XAG) is currently at 63.70, and it’s forming an inverse head-and-shoulders pattern on the daily chart. For the uninitiated, a rising ratio means gold is flexing its muscles against silver.
If the ratio breaks above 69.50, we’re in for a nice little ride toward 74.56. A ratio of 74 would suggest that gold is putting silver in the shade, pulling in all those eager investors who are looking for a stronger store of value.
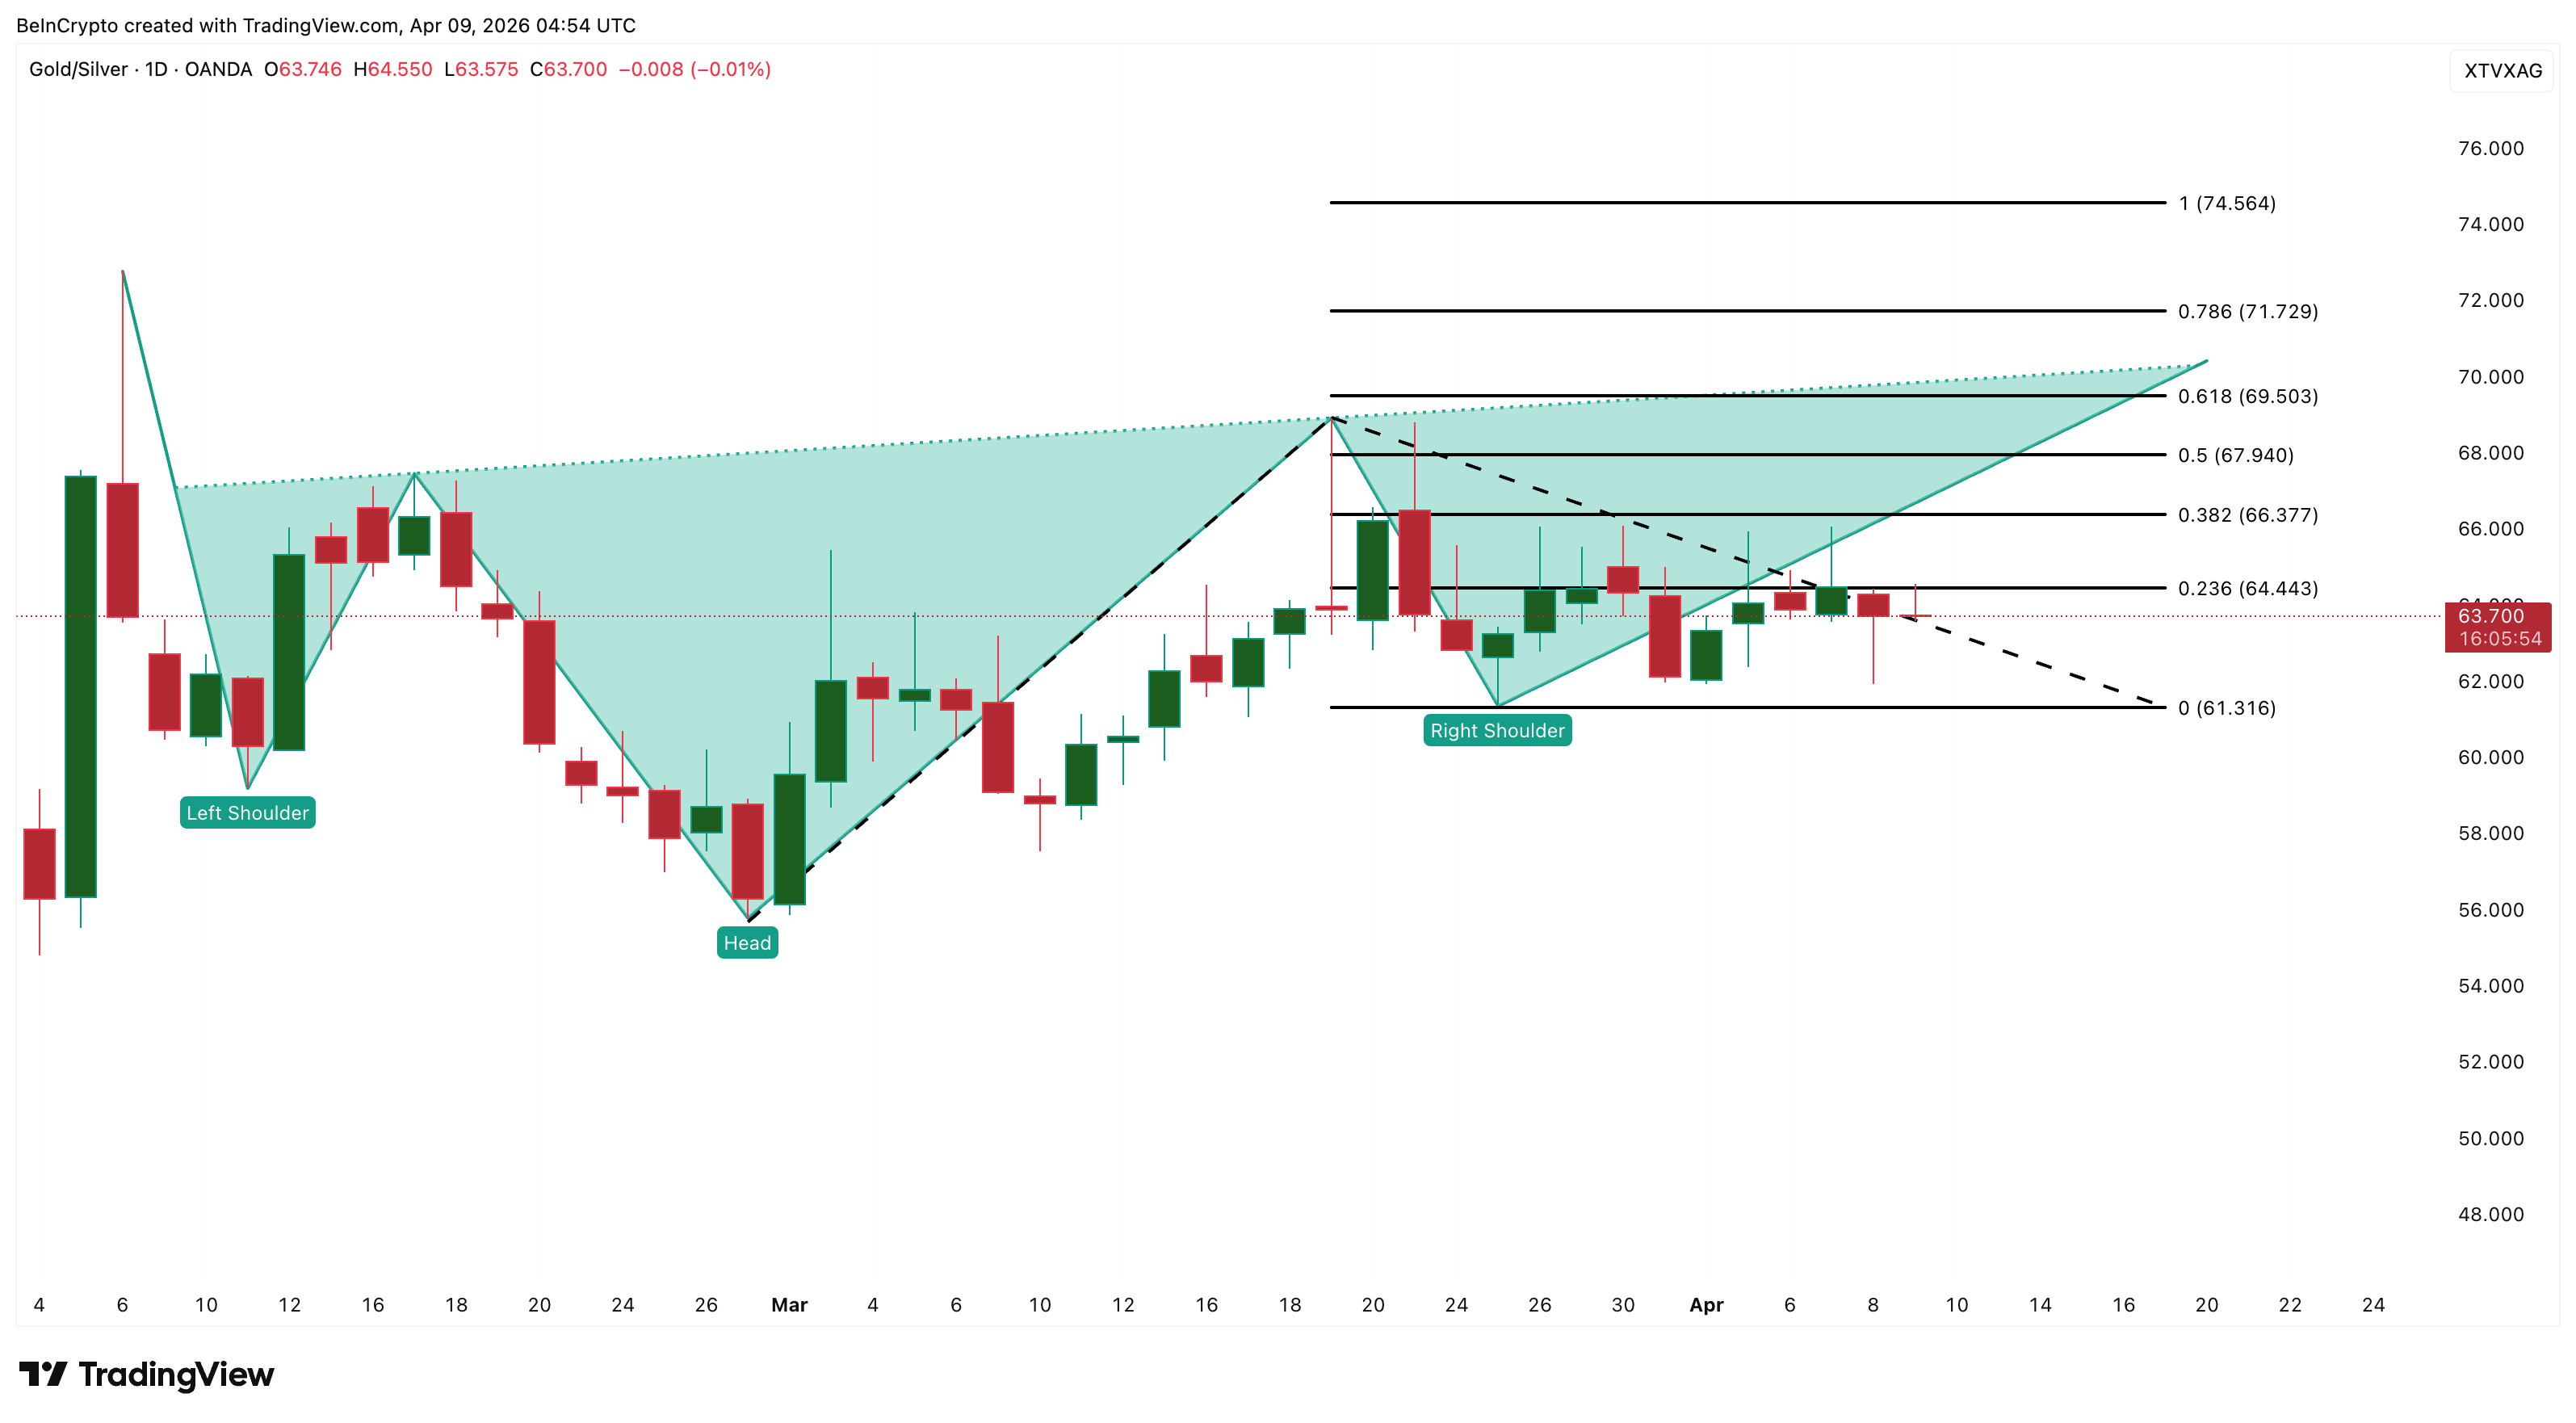
This matters for gold because, even if the dollar stays strong and both metals decide to take a nap, gold would still be the more robust of the two. In a scenario where the dollar falls and both metals take off, gold would take the lead. Either way, the ratio is giving gold the upper hand.
With all these signals – divergence, EMA reclaim potential, and a bullish ratio structure – pointing toward a continued bullish run, the next step is all about price action.
Gold Price Levels That Determine if $5,000 Is Reachable
Gold is currently at $4,722, and the critical resistance level sits at $4,852, which is a mere 2.72% above where it is now. This level is where the April 8 rally got slapped down. A daily close above $4,852 would give us a big ol’ confirmation of a breakout, bringing $5,000 into focus.
Beyond $4,852, the next target is $5,030 – that’s the big, shiny $5,000 zone. After that, the road leads to $5,283, and eventually, $5,605, near the peak back in January. But for all that to happen, the DXY has to dip below $98.52 and the gold-silver ratio needs to keep pushing up.
If gold tumbles, the first support is $4,674 at the 0.382 level. A slip below that and we’re looking at $4,455 at the 0.236 level. If we breach the March 23 low of $4,098, well, things would look a bit grim. A break below $4,557 would signal the end of the bullish divergence and shift the momentum bearish.
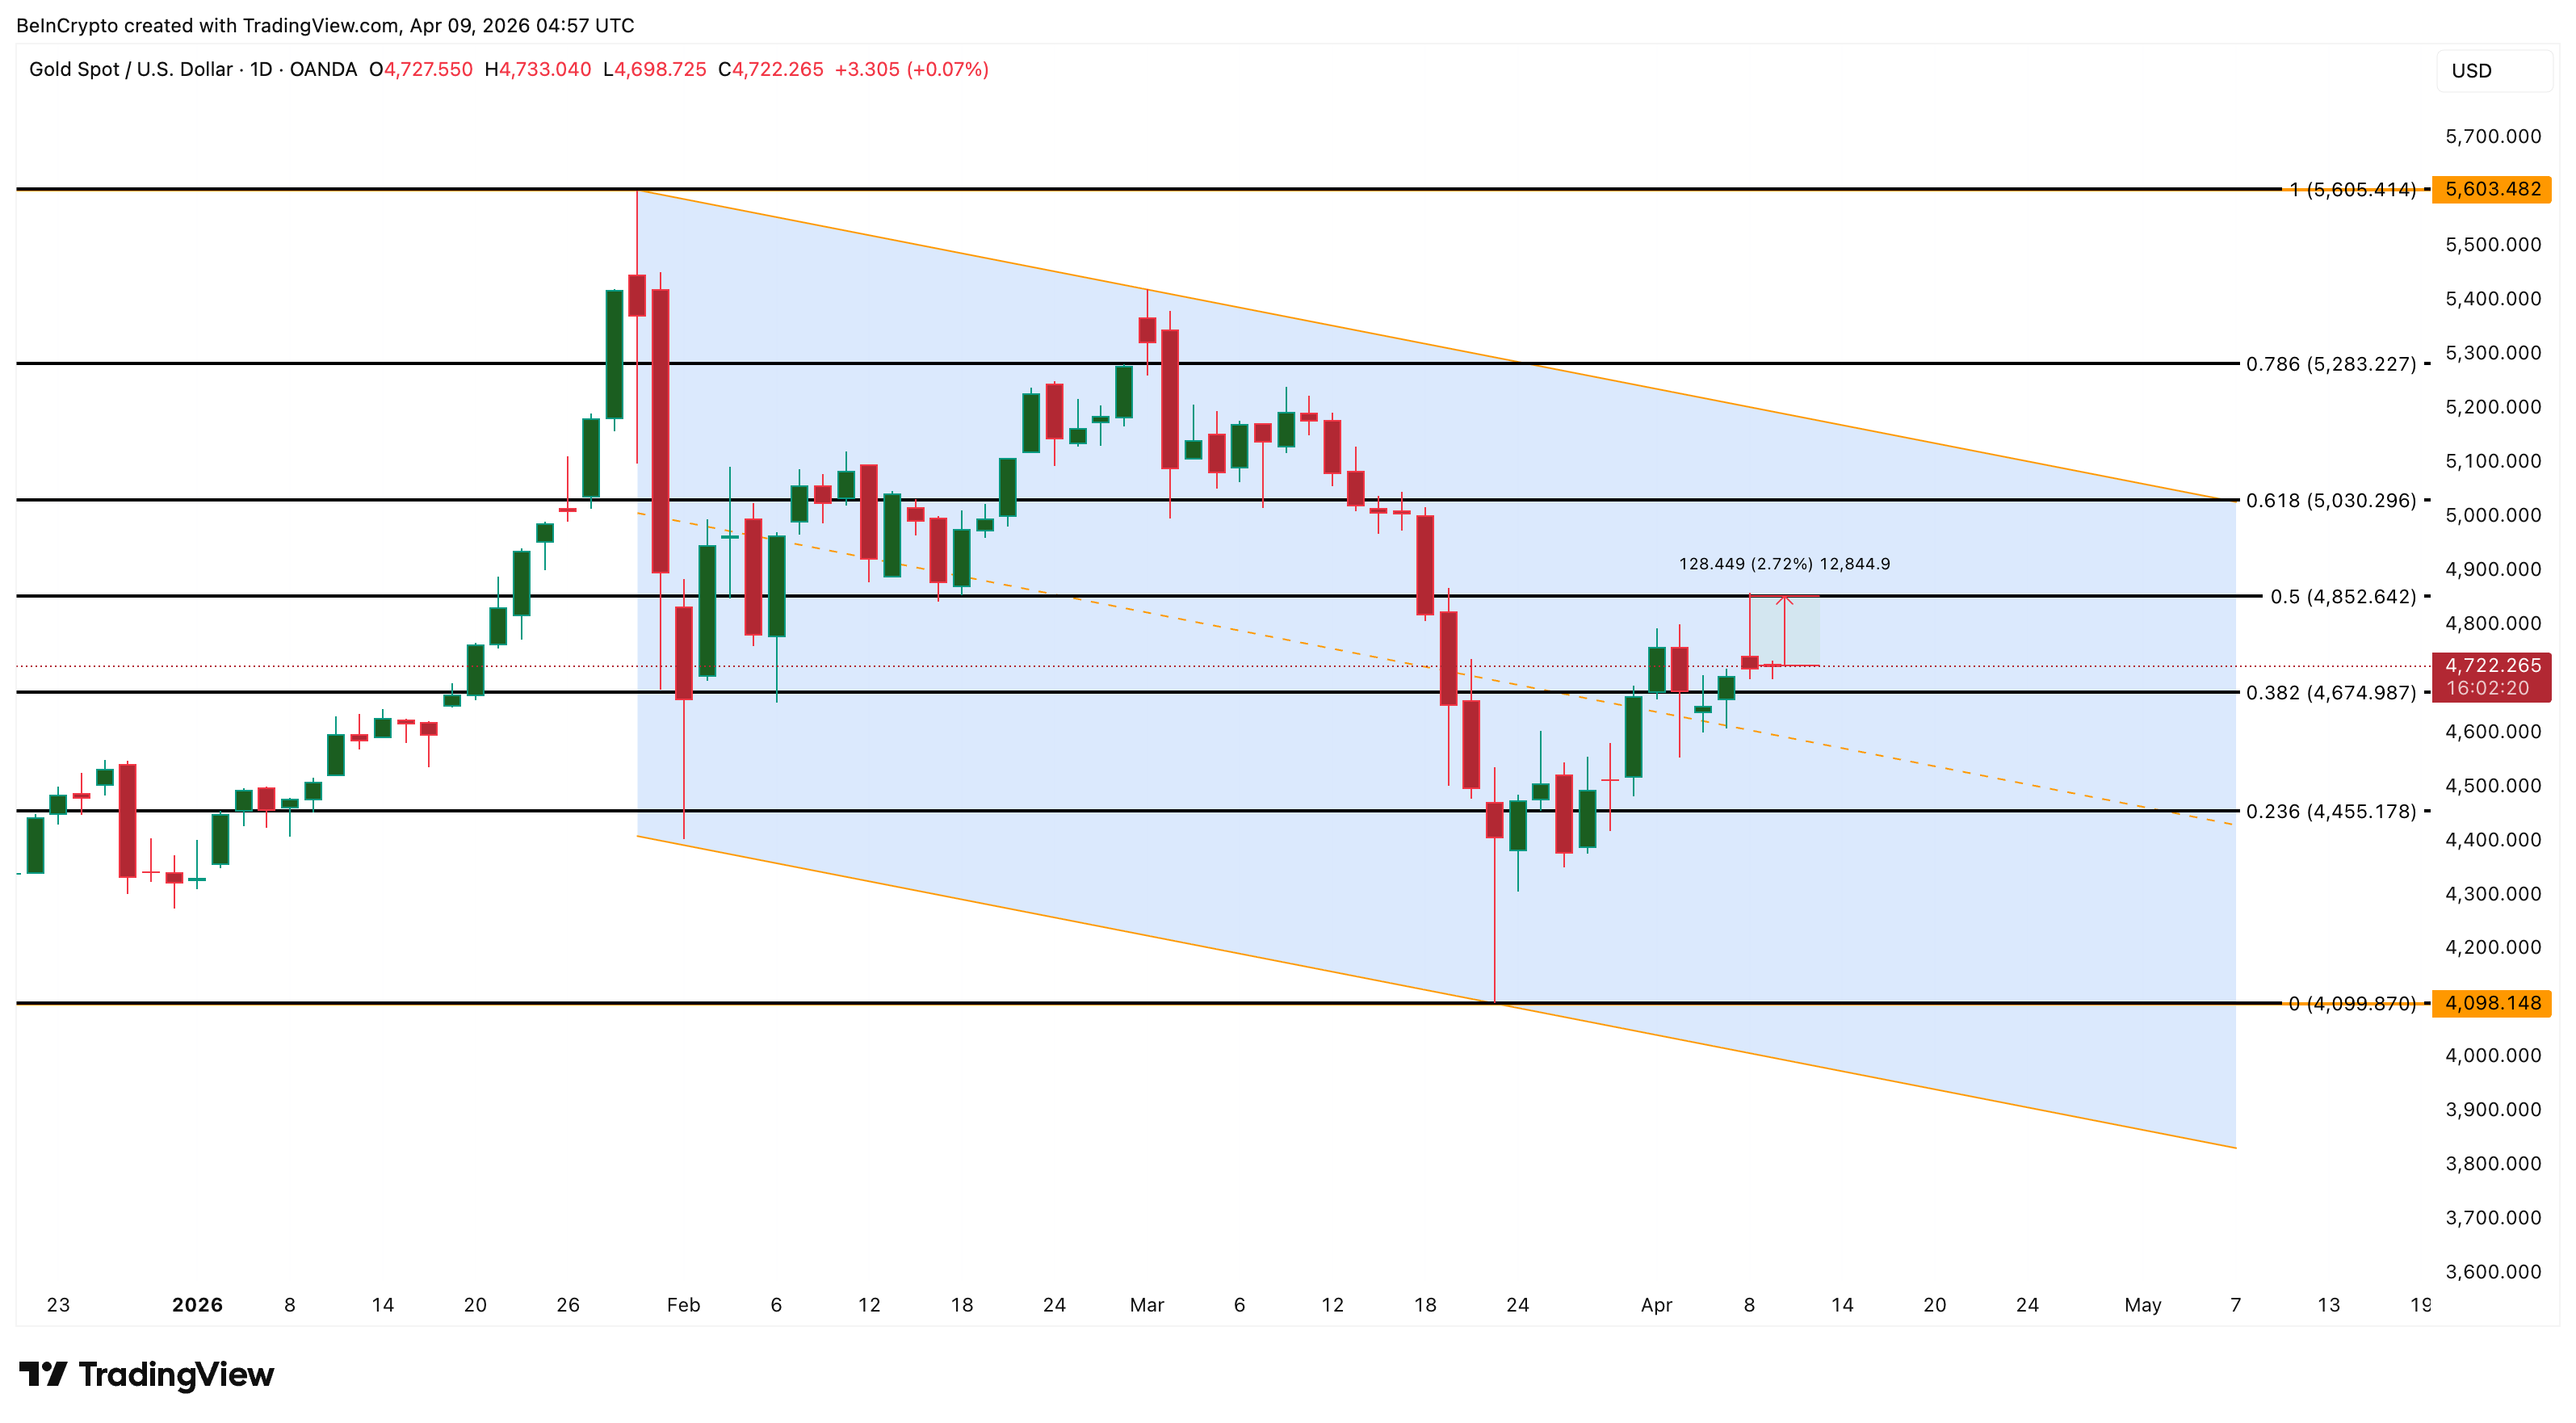
Right now, $4,852 is the golden line between a confirmed breakout toward the $5,000 zone and a potential retreat to $4,674. Make your peace with it.
Read More
- Gold Rate Forecast
- Brent Oil Forecast
- GBP EUR PREDICTION
- Silver Rate Forecast
- USD ARS PREDICTION
- CNY JPY PREDICTION
- USD JPY PREDICTION
- GBP JPY PREDICTION
- BTC’s Descent: A Tale of Gold, Tariffs, and Market Melodrama 🏦📉
- Crypto Whales Rise from the Dead! 🐋💸
2026-04-09 15:21