Alright, folks, let’s dive into the thrilling world of HBAR trading charts, where every tick can feel like a plot twist in a Netflix drama. The $0.22-$0.23 support region is the latest episode’s cliffhanger, and it’s about to get juicy. While we’ve seen some promising bullish moments, the recent retracement has everyone on edge, wondering if the HBAR train will keep chugging along or hit a major derailment.
Near-Term Support Holds the Key for HBAR Direction
According to the 3-day chart reviewed by the ever-so-insightful Steph is Crypto, this $0.22-$0.23 support zone is like the safety net in a circus act. It’s been there to catch HBAR during previous falls, and now it’s the make-or-break point for the next big move. The rallies in July and August were impressive, but they’ve brought us right back to this crucial level, testing the resolve of those brave buyers.

Steph’s analysis suggests that if HBAR can hold strong above this zone, it might just be the spark that reignites the bullish flame, pushing the price back up to the $0.31 to $0.35 range. But, if it breaks below $0.22, well, let’s just say the bears will be having a field day. The next few days will be crucial for traders trying to read the tea leaves and predict the token’s next move.
Market Activity Reflects Consolidation and Uncertainty
Data from BraveNewCoin gives us a peek into HBAR’s recent trading stats. Currently priced around $0.23, it’s down about 4.7% over the past 24 hours, with some intraday wiggles between $0.227 and $0.232. Despite the slight dip, HBAR still holds its place as the 23rd largest cryptocurrency by market cap, valued at nearly $9.63 billion, with a whopping 42 billion coins in circulation.
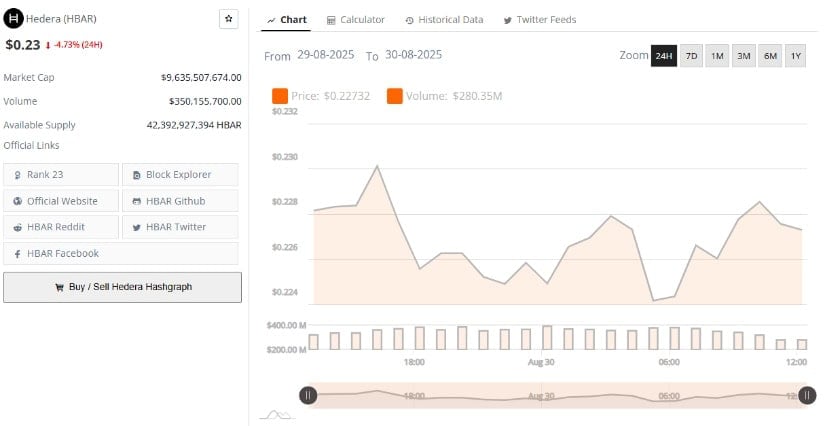
The trading volume of almost $350 million shows there’s plenty of action, with an initial pop to $0.228 quickly followed by a swift retreat to $0.227. This seesaw movement suggests a bit of market indecision, where neither buyers nor sellers are fully in control. If buyers can defend the $0.23 level with solid volume, it might just tip the scales in favor of a bullish rebound. On the flip side, if the sellers come out strong, it could spell more trouble for HBAR.
Technical Indicators Highlight Bearish Pressure Amid Rebound
TradingView’s daily chart, complete with Bollinger Bands and MACD, paints a nuanced picture of HBAR’s current state. At around $0.2255, the token is just above the lower Bollinger Band at $0.2230, hinting at an oversold condition that could lead to a short-term bounce.
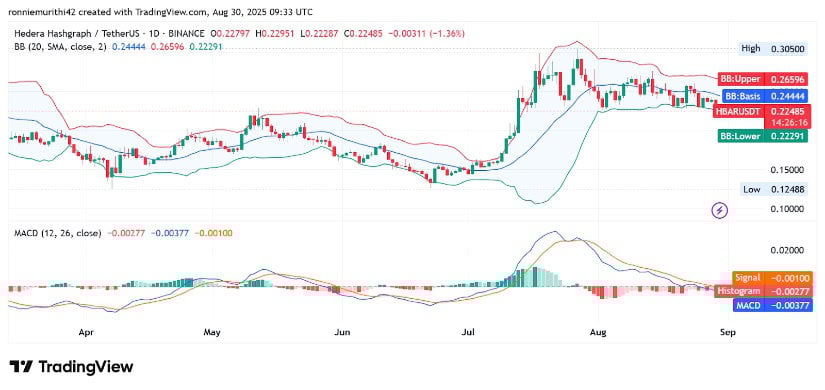
However, the bearish momentum is still evident, with the MACD line below its signal line at -0.00372 (compared to -0.00099), and the histogram at -0.00273. This setup confirms that selling pressure is still a thing, but the narrowing histogram bars suggest that this momentum might be losing steam. Traders, stay vigilant and watch for any signs of stabilization near the lower Bollinger Band.
A bounce from this support could propel HBAR towards the basis line at $0.244, a key resistance level. But if it fails to recover, the next significant downside target is likely near $0.20, which would mean a deeper correction. So, whether you’re a die-hard HBAR fan or just a casual observer, keep your eyes peeled for these levels-they’ll be the key to navigating the short-term risks and opportunities.
Read More
- Gold Rate Forecast
- Bitcoin Booms Again! Whale Frenzy, Hype & a Shot of Hyper to the Moon 🚀
- USD HKD PREDICTION
- Silver Rate Forecast
- KakaoBank’s Bold Venture into Stablecoins: The Future of Digital Money or Just a Digital Distraction? 🚀💰
- WazirX Miracle: Hacked Bucks Bounce Back! 💸😂
- Bitcoin’s Bailout: Schiff Say’s ‘Gold Alleys’ & CZ’s Snarky Comeback 😂
- XRP’s 2026 Forecast Collapses-Banks Wave Goodbye to Crypto Dreams!
- Brent Oil Forecast
- WIF’s Bullish Surge: Will It Break the $1.30 Ceiling or Just Keep Dancing?
2025-08-30 21:28