After a months-long downtrend, XRP is now nearing the end of a descending wedge pattern around $1.3157. The 4-hour MACD has just turned positive for the first time since February, suggesting the selling pressure might be weakening. This could lead to a significant price movement with the next candle close.
Summary
- XRP is trading at $1.3157, pressing against the apex of a descending wedge pattern visible on both the daily and 4H charts, with the daily Supertrend bearish at $1.4894.
- The daily MACD histogram stands at -0.0222, while on the 4H chart the signal line has just crossed marginally into positive territory, signalling that bearish momentum is approaching exhaustion ahead of the wedge resolution.
- A confirmed daily close above $1.47 targets $1.50 and a potential challenge of $1.60, while a break below $1.27 risks an acceleration toward $1.14.
As of April 3, 2026, XRP is trading at $1.3157, a slight decrease of 0.33% for the day. The price is currently near the end of a descending wedge pattern that’s been developing since February, both on daily and 4-hour charts. The Supertrend indicator on the daily chart is showing a bearish trend, but this wedge pattern often signals a potential price increase, especially if the lower trendline continues to hold. This is because these patterns can indicate a reversal of a long-term downward trend.
Descending Wedge at the Apex
Looking at the daily price chart, we can see a downward-sloping resistance line and an upward-sloping support line getting closer together. The price is currently at $1.3157 and approaching the point where these lines converge, after recently dropping to $1.3033. The MACD indicator is still showing bearish momentum with a value of -0.0287, but the difference between recent bars is shrinking, suggesting that the selling pressure is starting to ease.
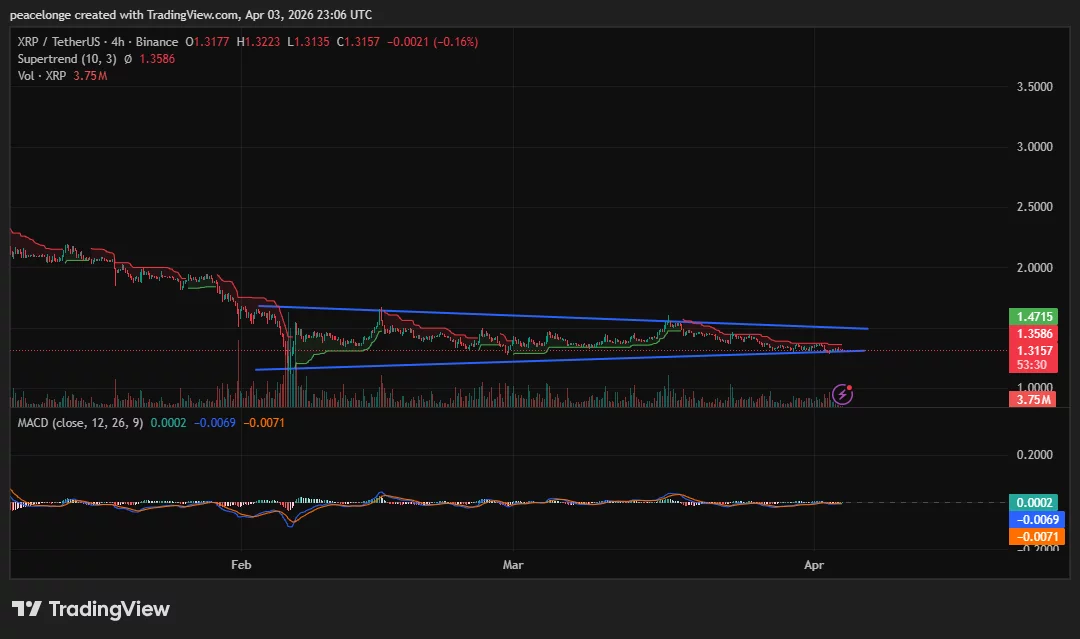
Looking at the 4-hour chart, I’m still seeing that wedge pattern holding up. The top line of the wedge lines up with my Supertrend indicator at $1.3586, and the bottom line has consistently acted as support since February. What’s interesting is my signal line just barely flipped positive at 0.0002, and the MACD is creeping closer to zero from the downside. We haven’t gotten a full bullish crossover on the MACD yet, but the fact that these lines are converging near zero suggests the selling pressure might be losing steam.
Key Levels, Price Targets, and Invalidation
Okay, so here’s how I’m looking at XRP right now. If the price can close above $1.47, that would be a really positive sign, confirming a breakout. My initial targets would be around $1.49, then $1.50. If we get *above* $1.50, things could get interesting, potentially testing a key resistance level around $1.60. Technical analyst Ali Martinez pointed out that, even at these levels, XRP might be a good short-term buy, especially considering its long-term upward trend. However, he also thinks there’s a chance it could drop another 30% before it really starts to recover consistently, so it’s definitely not without risk.
If XRP’s price falls below $1.27, it could signal a further drop to around $1.14, as it would break through a key support level. Currently, a large amount of XRP – about 19.6 million – is being held between $1.27 and $1.28, meaning strong buying pressure will likely emerge in that range to prevent further declines.
If the price falls below $1.27 at the end of a day, our optimistic outlook is no longer valid. Conversely, if the price rises above $1.47 at the end of a day, our pessimistic outlook is no longer valid.
On-Chain and Derivatives Context
Data from SoSoValue shows that U.S. XRP exchange-traded funds (ETFs) experienced net outflows in March 2026 – a first since their launch in November 2025. This removes a key source of buying pressure that had supported the price earlier in the year. Currently, open interest in XRP across all exchanges is around $2.45 billion, a significant drop of about 73% from its high point in September 2025, as previously reported by crypto.news.
Funding rates are now slightly positive at 0.008%, which indicates new buying activity is happening around the current price. At the same time, investors who have held positions for six to twelve months have started to sell some of their holdings since March 27th. This reduction in long-term support is occurring just as the price is nearing a critical point, potentially making it more vulnerable.
As we’ve previously reported, Bitcoin‘s attempts to recover have consistently failed when facing decreasing resistance. This pattern will likely continue unless buyers can firmly break above the upper boundary of the current wedge shape with a strong daily close. Currently, the short-term trend indicator is neutral, and as the wedge narrows, the next price movement will be particularly significant.
Read More
- Brent Oil Forecast
- USD ARS PREDICTION
- GBP EUR PREDICTION
- Gold Rate Forecast
- CNY JPY PREDICTION
- USD JPY PREDICTION
- Silver Rate Forecast
- GBP JPY PREDICTION
- Binance’s Korean Comeback: A Tale of Crypto, Chaos, and 🤑
- Ether’s Dance: A Tragic Waltz of Gain and Greed
2026-04-04 04:05