Litecoin is currently trading around $54, moving within a narrow price range. Analysts are observing a buying opportunity between $40 and $53, suggesting a potential price increase if it breaks out of this range.
Litecoin was trading around $54, and analysts are watching to see if it’s established a stable base after a prolonged period of declining prices.
Market focus returned after online commentary pointed to an accumulation zone between $53 and $40.
Although Litecoin’s overall trend was still downward, the recent slowdown in selling indicated a potential shift. This has led traders to closely monitor the cryptocurrency, anticipating either a significant price increase or decrease.
Litecoin Holds a Narrow Daily Range
Litecoin Price moved mostly between $52 and $58 after a sharp drop in early February.
After a rapid price drop from late last year, Litecoin’s price stabilized, but it hasn’t yet started to consistently rise.
Instead, the market formed a sideways pattern that looked more like consolidation than recovery.
The price found support around $53 and $52, with $50 acting as a key support level. On the upside, resistance was seen around $55 and $56, and a stronger resistance area formed between $58 and $60.
Those levels kept price boxed inside a narrow band and delayed a firm trend signal.
Because of that, short-term traders focused on daily closes rather than intraday moves.
The daily structure still leaned bearish because Litecoin remained below earlier swing highs.
Despite the initial drop in February, a long lower wick on the price chart indicated that buyers stepped in after the sell-off. This suggested underlying demand and helped stabilize prices around the existing support level.
For now, the chart suggested stabilization, but not a confirmed reversal.
Accumulation Claims Bring Litecoin Back Into Focus
A widely shared post said Litecoin had entered a new accumulation zone between $53 and $40.
The post compared current trading with the 2018 to 2020 period near cycle lows.
The analysis also suggested that a temporary dip in support could be a short-term attempt to profit from market fluctuations rather than a sign of long-term weakness. This idea gained attention because Litecoin hasn’t seen much price movement in recent months.
This stock is currently at $53 and facing significant challenges. It’s been heavily discounted and largely ignored by investors, but a major shift could dramatically change its position in the market.
Perfect.That’s Exactly How Every Major Litecoin Rally Started.
Look At The 3W Chart:2018-2020: Price Accumulated At The Bottom For 2 Years…
— Crypto Patel (@CryptoPatel)
The post also included potential price goals of $135, $219, $388, and $862. These predictions were based on a repeating pattern, but that pattern hasn’t been verified in the stock’s recent performance.
Even so, the idea gained attention as Litecoin stayed near lows and broader interest stayed soft.
Currently, these price levels are being watched as potential signals, but haven’t established a clear pattern yet. The next step will likely depend on whether Litecoin can rise above $58 or falls below $52.
A daily close above resistance could improve sentiment and support a move into higher ranges.
If the current price level doesn’t hold, Litecoin could drop back to around $50 or even $46, which was the lowest it reached in February. As long as the price stays within its current range, it’s likely to remain stable with no major moves expected.
Read Also:
Litecoin Targets $1,000 as Multi-Year Ascending Trendline Holds Strong
Momentum Signals Stay Soft but Stable
The Relative Strength Index (RSI) was around 45.8, indicating that momentum was a bit weaker than average. The average RSI was 50.6, and the difference between the two suggested that buyers weren’t fully in charge.
Although the RSI didn’t indicate a strong sell-off, it also wasn’t showing clear upward momentum, as it stayed below a key level.
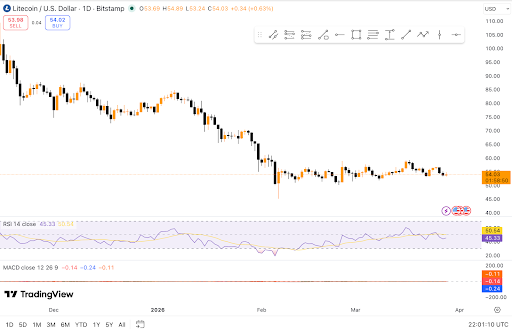
MACD also stayed negative, although the reading was only slightly below zero.
Although prices were still trending downwards, the rate at which they were falling had decreased. Traders interpreted this as a temporary pause in the market, rather than the start of a significant upward climb.
The histogram also stayed weak, which matched the slow and choppy price action.
Volume did not point to strong conviction during the recent sideways move.
Because of that, many chart watchers looked for a close above resistance before changing stance.
If the price stays above $58, it could signal a move towards $60, $65, and eventually $68. However, while the recent data suggested a potential bottom, it wasn’t enough to definitively confirm a rebound.
Read More
- Brent Oil Forecast
- 65% of Crypto Traders Earn Yield-But Who’s Counting?
- Ethereum’s DeFi Bet: Putting All ETHs in the Morpho Basket
- UMA’s Oracle Update: Now Only the Chosen Few Can Propose Market Resolutions 🚀🔒
- FTX’s $2.2 Billion Payout: Is Your Money Finally Coming Home?
- Gold Rate Forecast
- US Law Snows $23M Stablecoin & TRON Laughs All Way to Bank-Will TRX Moon? 🤡💸
- Solana’s Crypto Coup: Ethereum’s Fall from Grace!
- Dubai in ‘Danger’, ‘All Out’ Attack? Wait- Missiles, Drones & Who’s Afraid?!
- Polymarket’s Bold Move: DeFi Startup Acquired for $20B Ambitions!
2026-03-29 08:20