“Orange Dot” Mayhem: How One Tweet Jolted Bitcoin $4K in Hours 🚀💸
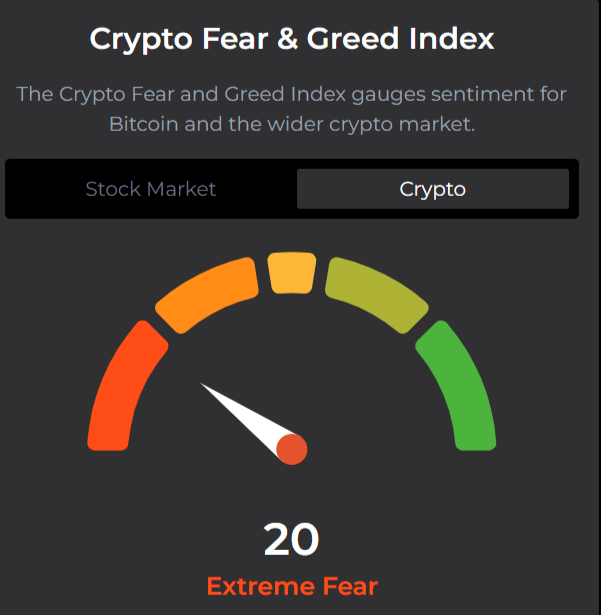
It’s utterly mesmerizing how a man, a dot, and a color scheme can make grown investors cry (or trade). Saylor’s tweets are less financial news and more interpretive dance for the terminally online. And somehow, it works. Even as the Fear and Greed Index screams “RUN” louder than your ex’s voicemail, people are buying. Welcome to the circus. 🎪