TONcoin’s $5.80 Dream: Bullish Dreams or Crypto Daydreams? 💸🚀
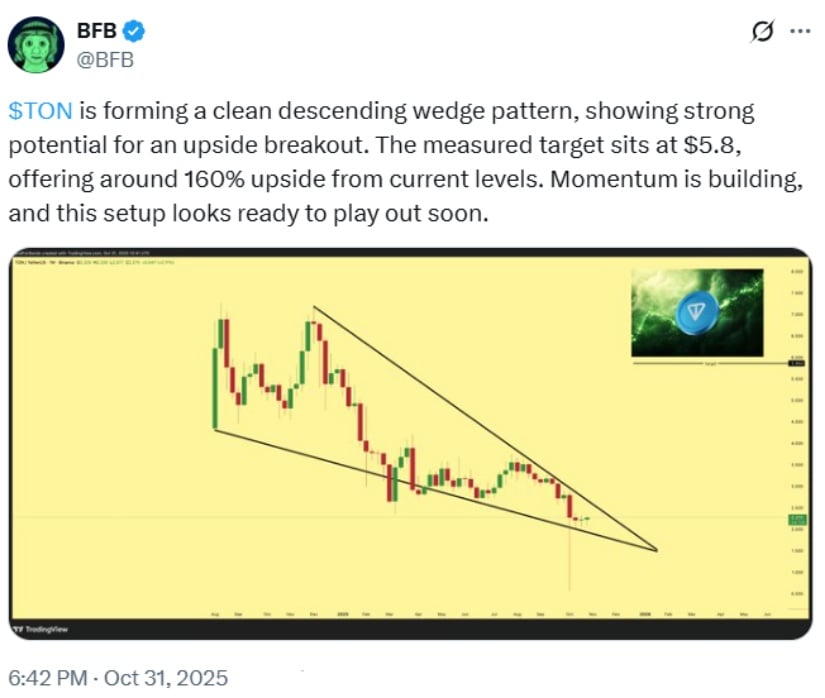
The descending wedge pattern that has formed on Toncoin’s chart since August 2025 has become the focal point for traders and analysts alike. This pattern is typically characterized by converging downward-sloping lines that reflect reduced selling pressure and growing accumulation among buyers. Once the price breaks above the upper boundary of the wedge with strong volume, it often signals the beginning of a new uptrend. 🐍📈