Picture this: two crypto gurus, a chart, and me pretending I’m not watching a soap opera. Dark Defender is back with a chart he says has survived every market tantrum since October 2023-the one chart that’s not just surviving, it’s auditioning for a long-term role. Meanwhile Steph Is Crypto catches XRP flirting with the improbable on a price site-43,032 dollars-only to have the converter remind us it’s really about 0.57. It’s like discovering your dog can’t fetch, but it can time travel. Ridiculous, right?
Dark Defender, the on-chain analyst and chart guy, returns to X with an update on a chart he says is the only technical structure that’s remained valid across the whole saga. It’s not magic, he swears; it’s Elliott Wave theory meeting Fibonacci extensions, which sounds less like investing and more like a math club that never stops arguing.
According to his post, this chart tracks XRP’s price action with the dedication of a caffeinated librarian. In two and a half years of roller-coaster market cycles, this chart supposedly stayed true. I’m not saying it’s a crystal ball, but I’m also not saying it isn’t-this is crypto we’re talking about, which is basically a weather forecast written in chalk on a fridge door.
XRP’s Technical Structure
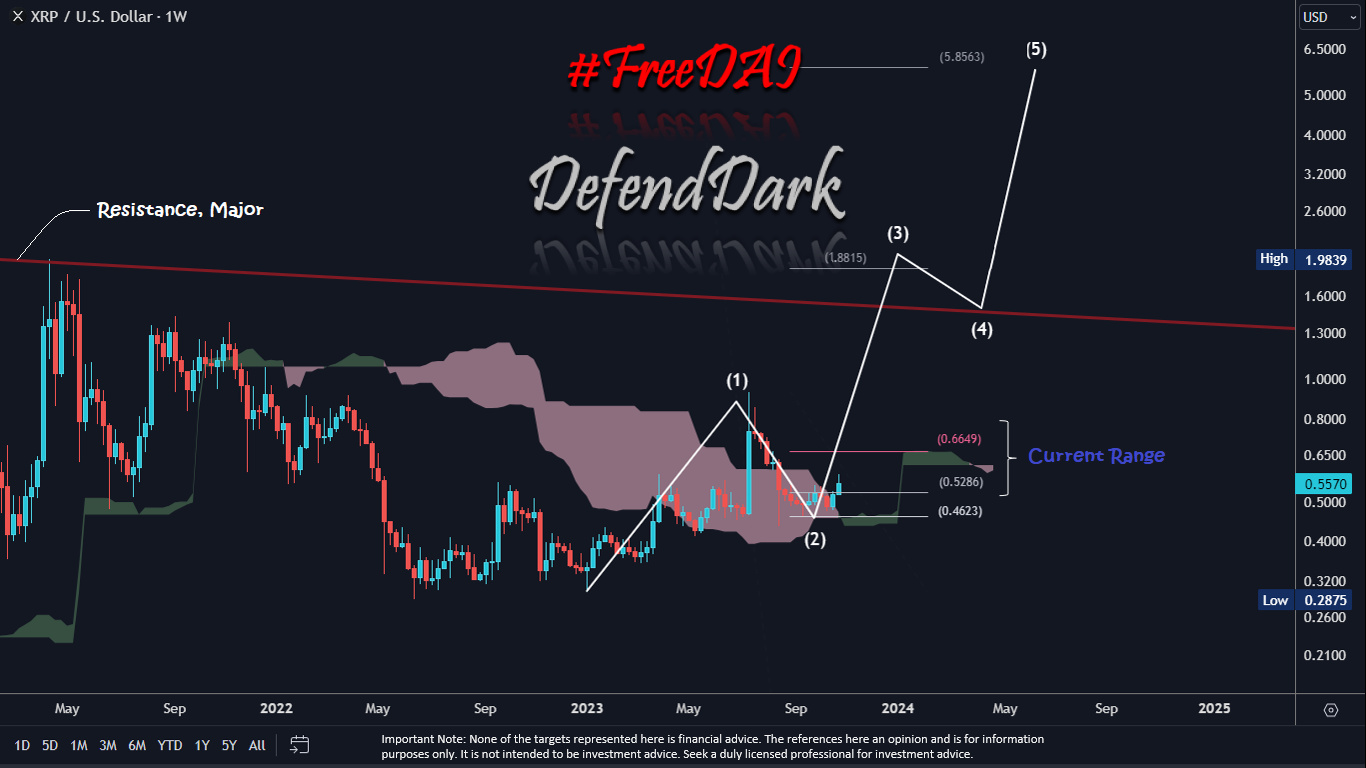
Dark Defender’s approach hinges on Elliott Wave theory and Fibonacci extensions-wonderful club names, by the way-mapping price action to old patterns rather than chasing quick momentum. He’s got targets above current prices, like around $2.58 and $3.56, with the recent correction apparently resolved on the weekly chart. Translation: the waves tell a story, and the story ends with you buying if the plot holds together.
He says a directional move is inevitable as long as XRP keeps its critical support intact-a condition the chart currently satisfies. It’s like telling you, “As long as the couch cushions stay fluffy, we’ll probably find a quarter.”
Longer-term, he eyes a Wave 5 projection toward $5.85 and beyond Fibonacci levels, but these are contingent on the broader wave structure staying in line. In other words: don’t buy the pizza until the crust holds up.
The only chart that has stayed valid since 25-Oct-23.
Just look at the levels, how well they played.
It will continue.
Gigantic success for #XRP is on its way.
– Dark Defender (@DefendDark) May 10, 2026
The $43,032 Moment
Separately, Steph Is Crypto posted a video showing XRP briefly hitting $43,032.32 on a major price tracker. The currency converter on the same page showed XRP at about $0.57, making the whole thing look like a platform glitch-proof that numbers can argue with themselves and win. The XRP crowd clapped anyway, because why not chase a unicorn that’s probably just a glitch in the matrix?
Yes, it was a data hiccup, but our analysts treated it as a shiny footnote to their bullish Bible-proof that anything’s possible when you’re counting waves and glitches at the same time. It’s like finding a sale sign in the bakery aisle of a hardware store and calling it a crypto signal.
Right now XRP hovers around $2.11, perched above support and well below the resistance belt that separates “maybe something happens” from “this time it sticks.” The CLARITY Act is wending its way through the US Senate, and traders are pricing the odds of passage in 2026 at over 60%. A clean legislative win, paired with this technical setup, could finally push XRP out of its long nap of consolidation into real action. Or it could be another episode of “Wait, did we misread the chart again?” Either way, the drama remains entertaining.
As of this writing, XRP sits around $2.11, holding its ground above crucial support while analysts chase the dream of a decisive breakout. It’s one of those moments where you’re not sure if you’re watching a price move or a well-scripted comedy routine about market fate.
Cover image from Grok, XRPUSD Chart from Tradingview
Read More
- XRP’s Price Tango: Can It Outdance the 100 EMA?
- Gold Rate Forecast
- 10M Crypto Users Targeted by Malware Ads!
- Top 5 Hilarious Mistakes That Cost This Trader $2 Million on Polymarket! 😱💸
- Silver Rate Forecast
- Base Loses $1.4B: A Tragicomic Tale of Chains, Cash, and Clashing Visions
- USD ILS PREDICTION
- Ripple moves 250M XRP – Can supply crunch trigger a $2.50 move?
- Bitcoin’s Plunge: A Tale of Woe and 0.3% Despair
- Bitcoin Mining Difficulty Plummets: The Universe’s Most Dramatic Haircut (Again)
2026-05-12 13:20