Look, the charts are doing this transition thing. The market’s in a phase where it pretends to be decisive but keeps stalling. Multimonth downtrends? They seem to be burning out, or at least losing their punch. The price is still technically below the major moving averages, which is not exactly a victory parade, but the vibe is different-the decline has a different mask now.
XRP‘s transition phase has been reached
Momentum is fading, selling pressure isn’t sprinting, and the bears are running out of clean downside moves to squeeze out. XRP printed a string of lower highs and lower lows in a descending channel for months, and every rally got knocked down before it even warmed up. The trend control? It’s clearly with the sellers.
There hasn’t been much follow-through selling, and the last leg down didn’t produce a big continuation candle. Instead of expansion, the price is compressing near a historically reactive zone. Even before a reversal is obvious, compression after a long slide is often the first sign that the trend is winding down.
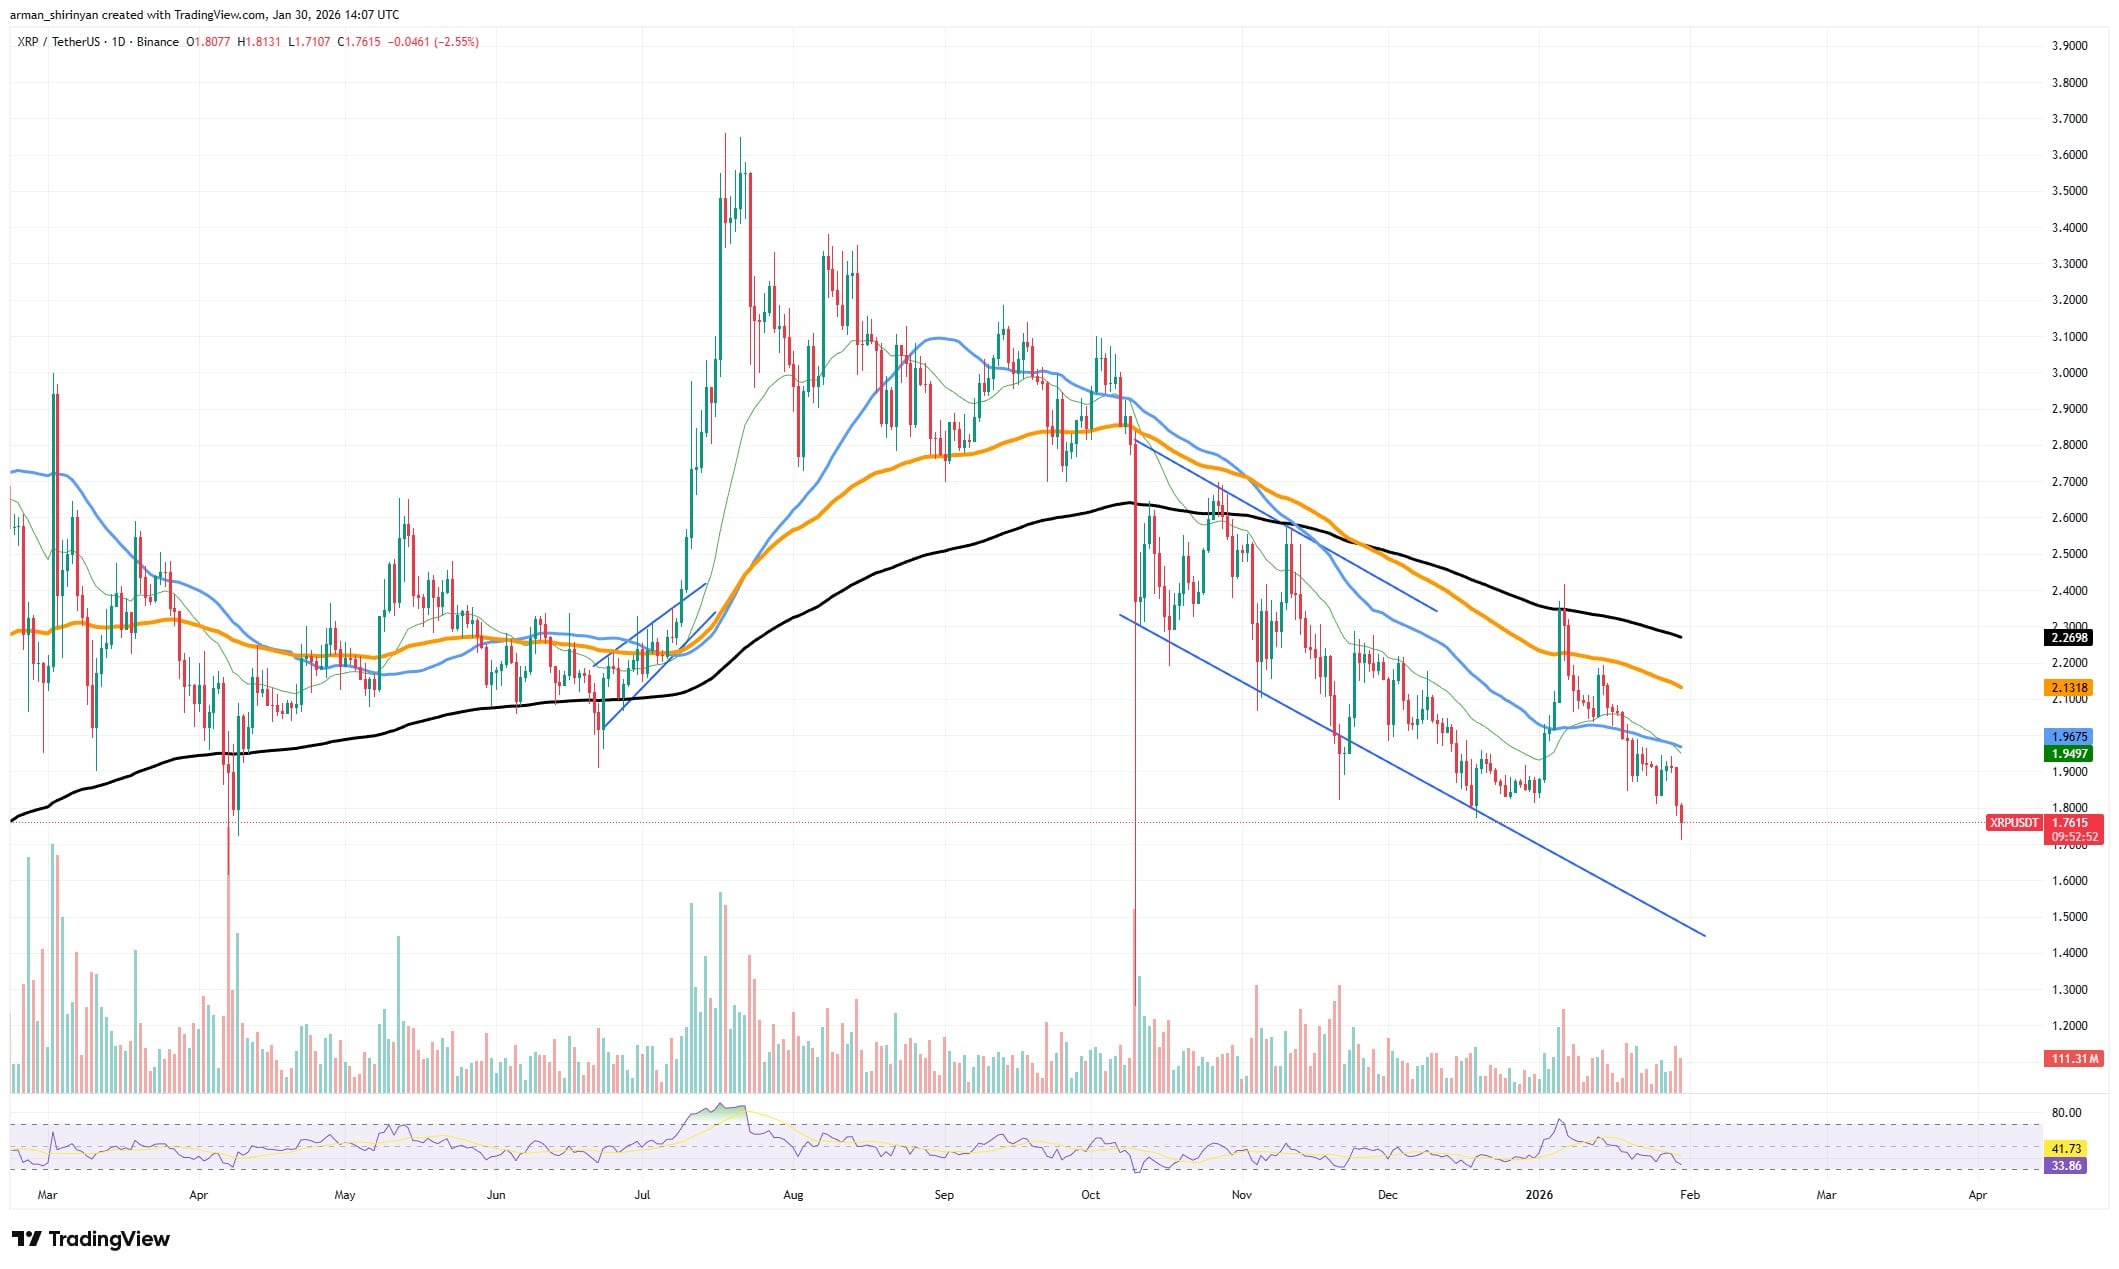
This interpretation is supported by volume behavior. Big spikes came with earlier capitulation events, but the latest downside attempts are happening with lighter participation. When a market trends lower with shrinking volume, it means seller fatigue. There’s less aggressive supply in the order book. Bears can push price lower in the short term, but the energy behind the move is clearly reduced.
From a structural standpoint, XRP is approaching a point where the risk-reward of new short positions isn’t appealing. Most of the obvious selling has already happened after a long decline, and late bears are entering at levels where bounce probability goes up, not down. Even if a full bull trend doesn’t start immediately, this dynamic often ends the downtrend.
This doesn’t guarantee an explosive rally. Markets rarely jump from a sharp decline to a vertical recovery without establishing a base. What’s more likely is a period of stabilization followed by a relief rally that resets positioning. The main takeaway is that the aggressive downward trend is waning.
At current levels, XRP looks less like a falling asset and more like it’s entering accumulation territory. The downtrend isn’t reversing violently yet, but its grip is loosening-and that alone changes the outlook. Investors should anticipate recovery attempts, or at least a pause in persistent downside pressure.
Shiba Inu takes hit
Shiba Inu keeps getting squeezed by bearish pressure, and the chart shows a market that hasn’t escaped the broader downtrend yet. Price action stays below all the major moving averages, which are sloping downward and acting like a big wall. Every bounce has been sold into, reinforcing the pattern of lower highs that defines the trend.
A tightening triangle near local lows is the latest wrinkle. Rather than signaling strength, this formation comes after a long decline and reads as indecision more than accumulation. Buyers show up, but their impact is limited. Each bounce is shallow, and volume doesn’t convincingly expand on up days. That imbalance suggests demand is reactive, not aggressive.
The bigger picture matters more than the short-term pattern. SHIB has been stair-stepping lower since its last peak, and there’s no clean reversal signal yet-no higher high or break above key resistance. Until that happens, rallies look corrective. The moving averages hovering above price form a ceiling that would require serious momentum to reclaim.
In the near term, a little volatility spike can’t be ruled out as the triangle resolves. A small relief bounce toward the nearest resistance cluster could happen. But the dominant trend still favors the sellers. Without a decisive shift in structure and volume, upside moves are likely to be temporary and limited.
Bitcoin is fine for now
Bitcoin is under pressure in the short run, but the bigger picture still suggests relative stability as long as it sits above the critical $80,000 zone. The recent dip has pushed BTC toward the bottom end of its multiweek range, but it hasn’t broken the level that would signal structural damage. For now, this reads as a correction inside a larger consolidation rather than a breakdown.
The chart shows Bitcoin trading below its short-term moving averages, signaling weak momentum and cautious sentiment. Sellers have the edge in the near term, but their control isn’t absolute. The $80,000 territory acts as both a psychological and technical support level, reinforced by past reaction lows and heavy historical volume. Those zones tend to be defended vigorously, especially after protracted declines.
Bitcoin is unlikely to face major long-term trouble unless it drops sharply below $80,000. Keeping a grip on this area could encourage range trading and eventual stabilization, letting buyers regain confidence. For now, Bitcoin stands at a stress test, not a collapse point.
The $80,000 threshold remains the line between a manageable correction and a deeper bearish phase. A breakdown would tilt the narrative toward more downside exploration.
Read More
- BTC Plummets: Fed Cuts Ignored in Crypto’s Absurdist Farce! 🤡💸
- Ripple Swoops in on Bitcoin’s Heels: 2030 Gold Rush
- Will SUI Soar to $7 Despite 6% Plunge? 📈🚀
- Bitcoin’s Laziest Coins Finally Roll Off Couch-What Happens Next Will Blow Your Mind! 🍿
- A Gentleman’s Guide to Dogecoin’s Imminent Gallop-Or Perhaps a Tumble
- Pasternak’s Hot-ETH Ticket: Half a Billion Bucks & the Moon’s Already Jealous!
- XRP’s Little Dip: Oh, the Drama! 🎭
- Get Ready for Ether’s Dramatic Ascent-More Than Just a Craving for Fame! 🚀💥
- Silver Rate Forecast
- OpenAI Just Made AI Models Free – Because Who Doesn’t Love Free Stuff?
2026-01-31 03:25