XRP is currently holding steady near a key support level and appears to be starting to stabilize. While the overall trend is still facing challenges, recent price movements and technical indicators suggest that selling pressure might be easing, potentially leading to a rebound in the near future.
Ripple Price Analysis: The Daily Chart
XRP’s price has stabilized on the daily chart, trading within a range of $1.05 to $1.15. This consolidation happened after XRP found support around the bottom of its downward-trending channel, suggesting buyers stepped in at that level.
Recently, a key development has emerged: the price of XRP is moving differently than its RSI indicator. Even though the price briefly fell back to around $1.05, the RSI actually showed increasing strength, suggesting that downward momentum is slowing down. This kind of pattern often signals that the price might be about to reverse direction and that selling pressure is decreasing.
XRP bulls are currently facing strong resistance between $1.35 and $1.55, an area where a key downward trendline meets several important moving averages. If the price can break above this range, it would likely boost confidence and potentially start a new upward trend. However, until that happens, XRP is expected to continue moving downwards as part of a larger, ongoing decline.
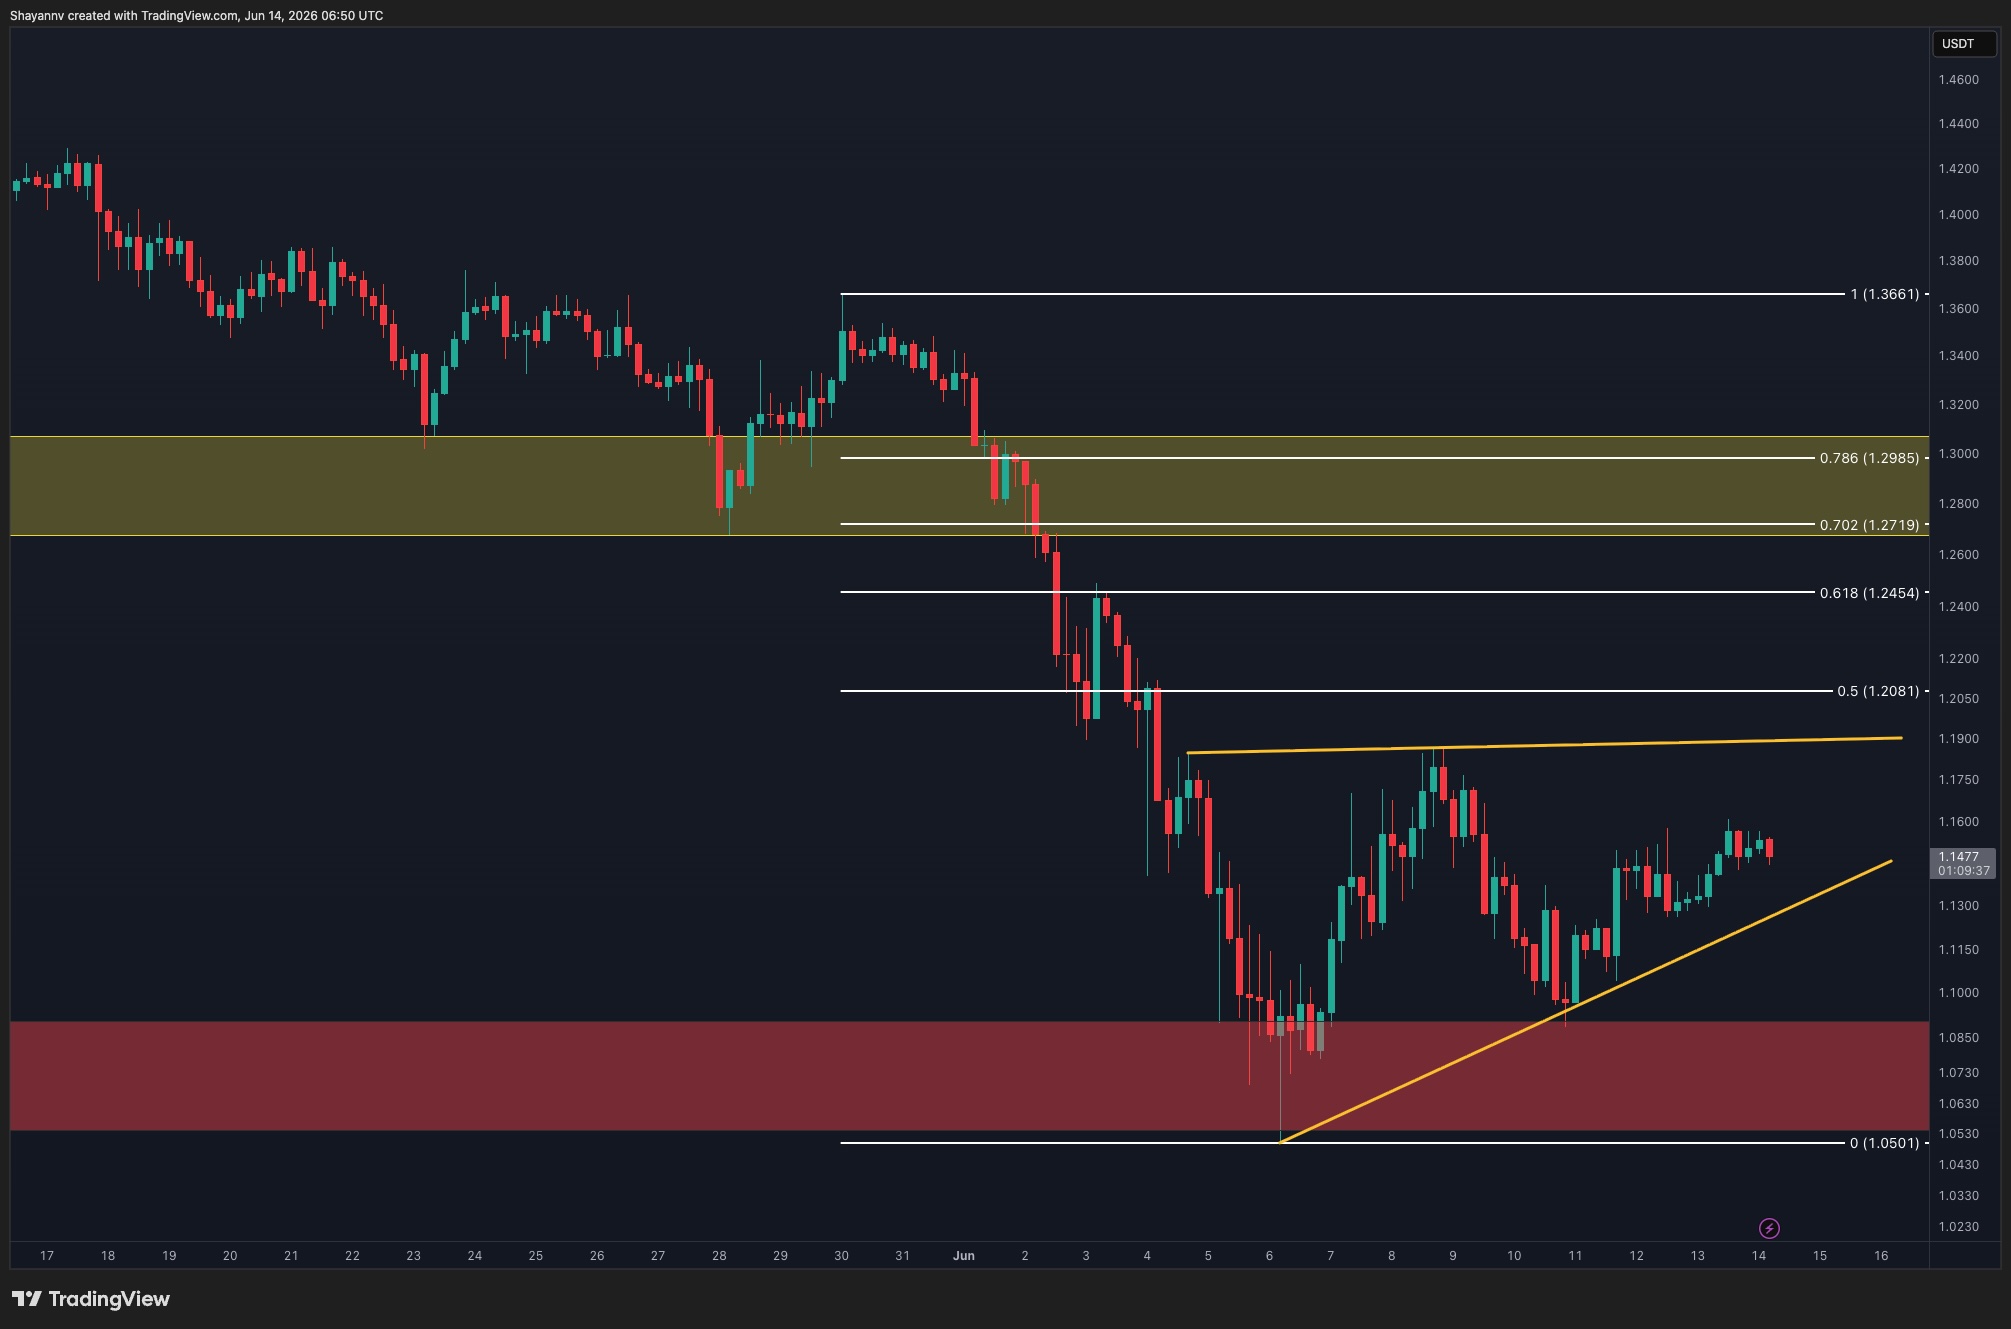
XRP/USDT 4-Hour Chart
Looking at the 4-hour chart, XRP is slowly recovering from around $1.05. The price has been making higher lows while following an upward trendline, which suggests the short-term outlook is getting better.
XRP is currently facing some resistance between $1.18 and $1.21, especially around the $1.21 mark which corresponds with a key technical level. If XRP can break above this resistance, it could potentially rise to $1.25.
In my analysis, I’ve identified a key resistance zone between $1.27 and $1.30. This is where some important Fibonacci retracement levels – specifically 0.702 and 0.786 – align. Interestingly, this same area used to support the price, so now it’s likely to present a challenge for any further upward movement.
From my analysis, XRP looks positive as long as it stays above the current upward trendline and holds the $1.05 support level. I’m expecting to see further price increases in the short term if this holds true. However, we really need to see a strong break and hold above the $1.21 to $1.30 range to confirm a more significant, lasting bullish trend. The fact that the daily RSI is showing a positive divergence gives me confidence that buying pressure is starting to build.
Read More
- Gold Rate Forecast
- CNY JPY PREDICTION
- USD MXN PREDICTION
- CNY RUB PREDICTION
- Silver Rate Forecast
- Brent Oil Forecast
- Senate’s CLARITY Act: A July 4th Fireworks Display or Political Fire Sale?
- USD PHP PREDICTION
- LAB PREDICTION. LAB cryptocurrency
- USD CNY PREDICTION
2026-06-14 18:06